15 Days Price Change
| FY24 | FY25 | FY26 | YOY % FY26 | CAGR % FY26 | |
|---|---|---|---|---|---|
| Net Sales | 327.1 | 747.9 | 783.2 | 4.7 | 54.7 |
| Other Income | 6.4 | 0.7 | 1.5 | 114.3 | -51.6 |
| Total Income | 333.5 | 748.6 | 784.7 | 4.8 | 53.4 |
| Operating Profit | 325.2 | 734.2 | 777.1 | 5.8 | 54.6 |
| Interest | 6.4 | 58.3 | 58.5 | 0.3 | 202.3 |
| Depreciation | 0 | 0 | 0 | 0 | 0 |
| Total Expenditure | 14.7 | 72.7 | 66 | -9.2 | 111.9 |
| Exceptional Income | 0 | 0 | 0 | 0 | 0 |
| PBT | 318.8 | 675.9 | 718.7 | 6.3 | 50.1 |
| TAX | 74.4 | 167.2 | 165.7 | -0.9 | 49.2 |
| PAT | 239.8 | 508.8 | 553 | 8.7 | 51.9 |
| EPS | 10.74 | 22.78 | 24.75 | 8.6 |
| FY24 | FY25 | FY26 | YOY % FY26 | CAGR % FY26 | |
|---|---|---|---|---|---|
| Shareholder Funds | 4144.5 | 4674 | 5184.3 | 10.9 | 11.8 |
| Total Debt | 700 | 700 | 700 | 0 | 0 |
| Current Liabilities | 315.3 | -150 | -412 | 174.7 | NAN |
| Non Current Liabilities | 700 | 700 | 700 | 0 | 0 |
| Total Liabilities | 5159.8 | 5224 | 5472.2 | 4.8 | 3 |
| Current Assets | -13070.2 | 2527.2 | 2644.5 | 4.6 | NAN |
| Non Current Assets | 1617.5 | -16651.2 | -19278.8 | 15.8 | NAN |
| Total Assets | 5159.8 | 5224 | 5472.2 | 4.8 | 3 |
| FY24 | FY25 | FY26 | YOY % FY26 | CAGR % FY26 | |
|---|---|---|---|---|---|
| Cash Flow From Operating Activities | 2004.8 | 2335.8 | 2051.9 | -12.2 | 1.2 |
| Cash Flow From Investing Activities | -3156 | -31710.7 | -1805.4 | -94.3 | -24.4 |
| Cash Flow From Financing Activities | 1538.5 | -37.2 | -101.3 | 172.3 | NAN |
| Free Cash Flow | 1903.7 | 2219.7 | 1913.1 | -13.8 | 0.2 |
| FY24 | FY25 | FY26 | YOY % FY26 | CAGR % FY26 | |
|---|---|---|---|---|---|
| ROE(%) | 5.8 | 10.9 | 10.7 | -1.8 | 35.8 |
| ROCE(%) | 6.7 | 13.7 | 13.2 | -3.6 | 40.4 |
| ROA(%) | 4.6 | 9.7 | 10.1 | 4.1 | 48.2 |
| Current Ratios(x) | -41.4 | 0 | 0 |
| Type | Period / Date | Document |
|---|
| Type | Period / Date | Document |
|---|
| Type | Period / Date | Document |
|---|
| Type | Period / Date | Document |
|---|---|---|
| Research Report | 2026-06 |
Driven by rising incomes, financial awareness, and rapid digital adoption, India’s insurance industry is one of the fastest-growing industries. Supported by government reforms, including 100% FDI, new product approvals without IRDAI nod, and digital distribution initiatives, the industry is projected to witness substantial growth between 2025 - 2029. Today, India’s insurance industry is a dynamic mix of traditional and digital channels, innovative products, and growing private sector participation.
However, the landscape is changing rapidly. The stability that insurers have long relied on is disappearing. The past few years have been characterised by a global pandemic, political unrests, global conflicts, supply chain disruptions, and high market volatility. Artificial intelligence, predictive analytics and active risk management will shape the future of the industry. Customer needs are evolving and it is imperative that insurers keep pace.
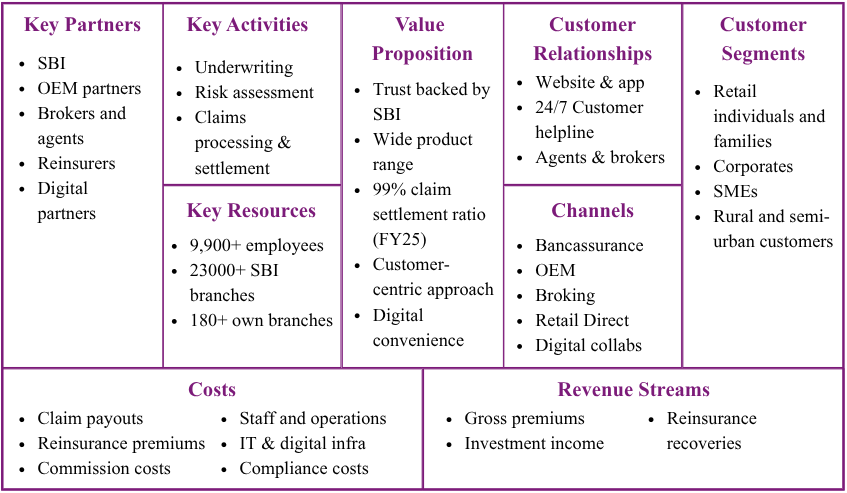
Established in 2009, SBI General Insurance is the non-life arm of State Bank of India (SBI), one of India’s largest and most trusted public sector banks in India. The company has expanded from 17 branches in 2011 to 180+ branches in 2026.
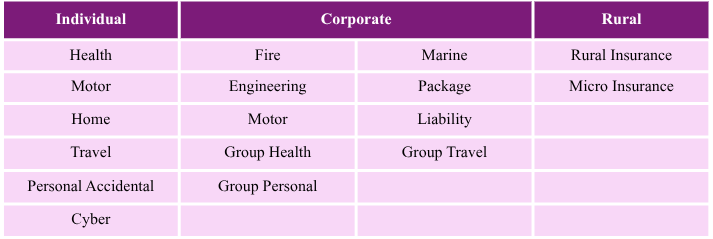
With a market share of 7.17% among private and SAHI players (up 27 bp from 6.90% in FY25), the company has grown at 1.6 times the industry growth rate. The performance was driven by Health (27% growth), Motor (16% growth), Personal Accident (40% growth), and Fire (10% growth). The company continues to lead the Personal Accident segment, maintaining its position as the No. 1 private and SAHI insurer.
The company has been improving its underwriting performance with loss ratio decreased to 78.3% in FY26 from 82.4% in FY25. The company plans to expand presence by strengthening distribution networks, deepening reach in Tier 2 and Tier 3 markets, and enhancing accessibility through various channels.
Leadership
Shareholding
Key Metrics:
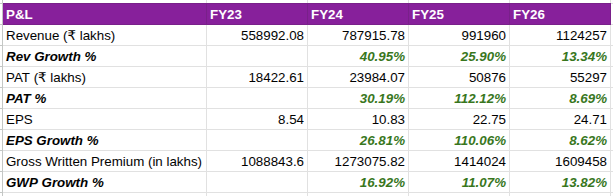
(Data Source: Annual Reports)
Key Ratios:
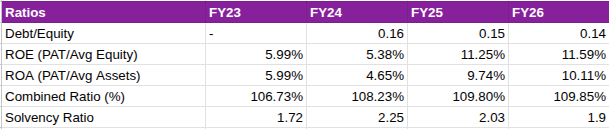
A. ROE & ROA
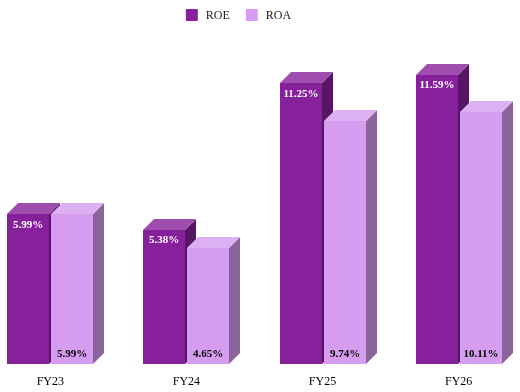
ROE improved from 5.99% to 11.59% in FY26, however, the jump is almost entirely driven by PAT (112% growth in FY25), which was most likely due to elevated investment income rather than underwriting improvement. From FY25 to FY26, the jump is of few basis points, which is a concern because even though the revenue is growing at double digits, it is not translating into proportional profit growth because underwriting losses are consuming the incremental investment income generated by a larger float.
ROA has been computed as PAT/Total Assets (as per balance sheet totals), hence the figures are significantly larger than other peers in the industry. A standalone comparison indicates an overall increase in ROA from 5.99% in FY23 to 10.11% in FY26. On a YoY basis, ROA decreased in FY24 to 4.65% due to increase in total asset base driven by inclusion of debt in the balance sheet. It then increased to 9.74% in FY25 largely due to growth in PAT.
ROA declined when capital was raised (FY24), spiked when markets were favourable (FY25), and has since plateaued — suggesting the ratio is being driven more by capital events and market cycles than by genuine operational improvement, which is precisely the same conclusion the combined ratio trend leads you to.
B. Solvency Ratio
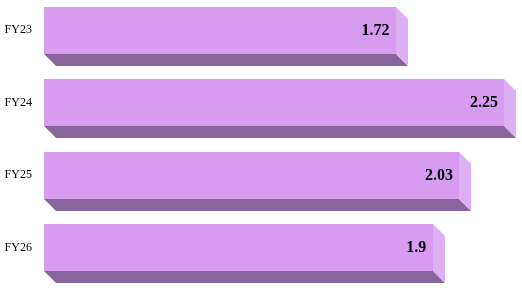
The solvency ratio measures an insurance company's financial health, indicating its ability to pay claims. Higher the ratio, greater the financial strength.
SBI’s solvency ratio is at 1.90x, 40 basis points higher than the regulatory requirement of 1.5x. However, if the decreasing trend continues in the future, it can be a point of concern. Significantly lower ratios could mean that SBI needs to inject capital.
C. Combined Ratio
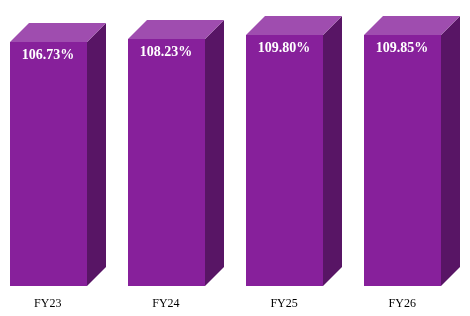
Combined ratio indicates how profitable the company is when underwriting insurance policies. The higher the combined ratio, the less profitable the company is when underwriting insurance policies (and vice versa). A ratio above 100% implies underwriting losses.
SBI’s combined ratio has been constantly increasing, a critical area of concern. The combined ratio has deteriorated every single year, from 106.73% in FY23 to 109.85% in FY26, a 312 basis point worsening over four years. The company's own guidance of reaching 107% in FY27 implies they acknowledge the problem, but it is important to note that 107% would still be worse than where they started in FY23 at 106.73%.
Methodology:
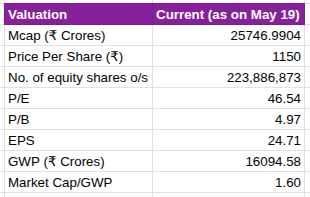
This valuation uses the Market Capitalisation to Gross Written Premium (MCap/GWP) ratio, a revenue multiple which is widely used to value general insurance companies. It measures the market value of an insurance company based on the total insurance premium generated by the company before reductions.
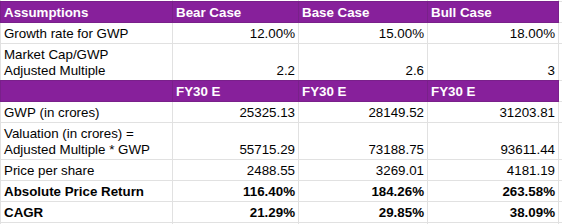
Growth Rate Assumption:
Market Cap/GWP Adjusted Multiple Assumption:
Analysis:
The bear case is essentially a slow execution scenario where the company grows in line with the historical rates. Even in this case, the return is attractive, a 21.29% CAGR. The bull case at 38.09% CAGR is ambitious but not implausible for a growing insurer, considering favourable regulatory environment and strong-parent backing. However, the case still rests on maintaining the GWP growth rate at 14-18% and improvement in underwriting profitability.
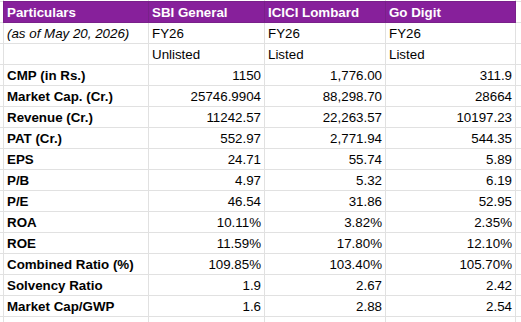
Valuation: SBI trades at a P/E of 46.5x, above the sector P/E of 37.9x, reflecting growth expectations rather than earnings quality. The market cap/GWP ratio of SBI General (1.6x) is at a steep discount to ICICI Lombard (2.88x) and Go Digit (2.54x), which reflects both the unlisted liquidity discount and the market's scepticism about underwriting quality.
Profitability: ICICI Lombard converted 12.4% of its revenue into PAT while SBI General managed just 4.9%, on par with Go Digit's 5.3%. The root cause here is the combined ratio. For SBI General, a 109.85% combined ratio is consuming its entire investment income to offset underwriting losses.
Solvency: SBI General’s solvency ratio of 1.9x, though above the regulatory requirements, is still the lower among its competitors. This matters because solvency headroom determines how aggressively a company can grow its underwriting book. With its stated ambition to grow market share in health and other segments, SBI General may need a capital infusion from SBI in the near to medium term.
ICICI Lombard is clearly the benchmark, the best combined ratio, highest ROE, strongest solvency, and despite the largest market cap, the lowest P/E. SBI General and Go Digit are at a similar maturity stage: both are growing fast, both loss-making at the underwriting level, and both relying on investment income for profitability. SBI General's edge over Go Digit is its bancassurance distribution moat and SBI brand
Strengths:
Weaknesses:
Opportunities:
Threats:
SBI General Insurance presents a compelling but conditional investment case. The company operates at the intersection of two powerful structural tailwinds - India's chronic underinsurance gap, with non-life penetration at just 0.9% of GDP against a global average of 4.3%, and the SBI parentage that provides an unreplicable distribution moat through 23,000+ branches. These advantages have translated into a consistent above-market GWP growth (1.6x). The company's leadership in the Personal Accident segment and accelerating health and motor portfolios demonstrate that the growth engine is real and diversified.
However, the financial analysis reveals a business that has not yet converted scale into underwriting quality. The combined ratio has worsened every year from FY23 to FY26, and at 109.85%, the company remains dependent on investment income to report a profit. Until this reverses, the discount to listed peers on MCap/GWP (1.6x vs 2.54 - 2.88x) is not merely a liquidity discount, it is a quality discount that the market is rationally applying.
Yes trading in unlisted shares is undoubtedly legal in India. The trading takes place in the over-the-counter market through various platforms like Sharescart.com.
No, SEBI does not regulate the unlisted share market but certain rules and regulations of SEBI are applicable in the unlisted market space as well, such as, the DP charges for each transaction, stamp duty, lock-in period and more.
You will get the best price for SBI General Insurance Company Limited and a hassle-free buying experience only on Sharescart.com platform.
SBI General Insurance Company Limited's unlisted shares can be easily purchased at Sharescart.com by following a few easy steps. Given below are the steps involved in the buying of these shares:
Step 1 - Confirm the number of shares you want to buy/sell of at the trading price.
Step 2 - Submit necessary documents like the Client Master Report (CMR) or additional documents (PAN, canceled cheque) if using a secondary bank account.
Step 3 - Transfer the trade amount to the account details shared by Sharescart.com.
Step 4 - Shares of will reflect in your Demat account within 24 hours after full payment (subject to holidays).
SBI General Insurance Company Limited's unlisted shares can be easily sold at Sharescart.com by following a few easy steps. Given below are the steps involved in the of selling of these shares:
Step 1- Confirmation on the number of shares you want to sell of SBI General Insurance Company Limited and at what price you want to sell.
Step 2- At Sharescart, we will find a suitable buyer for you according to your requirements and if you accept the trade we will move on to the transfer and the payment aspect of the trade.
Step 3- The Sharescart representative will provide you with the Demat account details to transfer your SBI General Insurance Company Limited shares. They will also notify you about the additional details required from your end before the transfer of shares such as client master copy, delivery instruction slip, and more.
Step 4- Once the transfer is complete, the payment would be credited to your bank account within 24 hours, depending on the holidays.
Over the years, the minimum ticket size for investment has dropped as more and more people have started investing in the Unlisted market. Currently, the minimum ticket size for SBI General Insurance Company Limited is between 259,000 to 316,000.
Brokers or dealers provide you with a trading facility means you can buy and sell shares with your broker but when you buy shares the Depository holds your shares. There are mainly two depositories NSDL and CDSL.
If you want to check your shares in NSDL and CDSL you need to download the application (NSDL Speede App or CDSL myeasi).
The taxation on the SBI General Insurance Company Limited shares may vary depending on 2 Factors:
Short-term capital
Unlisted shares - In unlisted shares, the taxation of short-term capital gain i.e. less than 24 months is taxable according to the investor's income tax slab.
Listed Shares - In listed shares, the taxation for short-term capital gains i.e. less than 12 months is at 20% without indexation benefits.
Long-term capital
Unlisted shares - The taxation for long-term capital gain i.e. more than 24 months is taxable at 12.5% without indexation benefits.
Listed Shares - The taxation for long-term capital gains i.e. more than 12 months is at 12.5% after an exemption of 1.25 lakh.
According to the current rule issued by SEBI last year in August 2021, the lock-in period is brought down from 1 year to 6 months. This was done to entice more investors to invest their money in pre-IPO companies and startups. The lock-in period of SBI General Insurance Company Limited varies depending on which type of investor you are:
You can check daily share prices of companies on our website or register with us using your phone number where you will get daily whatsapp updates on company news and other essential informations.

Buy or sell shares with confidence, backed by our research and expert guidance.
MyGate, the residential community management platform, has raised ₹225 crore from Dharana Capital.
Flipkart has received an NCLT notice after Applabs Media filed an insolvency petition alleging unpaid dues of ₹1.69 cror...

The Competition Commission of India (CCI) has approved Sanlam Emerging Markets' acquisition of an additional 2.8%...
SBI General Insurance may be the next SBI subsidiary headed for the stock market.

Immuneel Therapeutics has raised ₹100 crore in a Series B round led by Singularity AMC and Rainmatter.

Klassroom has received in-principle approval from BSE for its SME IPO and is targeting a listing in Q2 FY27. The issue com...
Zepto has filed its updated DRHP with SEBI for an IPO featuring a ₹8,010 crore fresh issue and an OFS by existing invest...
ixigo has acquired a 54.66% stake in Brevistay for ₹66 crore, making the flexible-stay hotel platform its subsidiary.

Inox Clean Energy is targeting an IPO in FY27 after withdrawing its earlier filing in 2025.

Flipkart-owned Myntra has settled alleged FEMA violations with RBI through a compounding process and paid a monetary penal...