15 Days Price Change

| FY24 | FY25 | YOY % FY25 | CAGR % FY25 | |
|---|---|---|---|---|
| Net Sales | 411.2 | 502.1 | 22.1 | 22.1 |
| Other Income | 121.3 | 8.8 | -92.7 | -92.7 |
| Total Income | 532.6 | 511 | -4.1 | -4.1 |
| Operating Profit | 480.1 | 378.6 | -21.1 | -21.1 |
| Interest | 78.7 | 0 | -100 | -100 |
| Depreciation | 0 | 0.3 | 0 | 0 |
| Total Expenditure | 401.4 | 378.4 | -5.7 | -5.7 |
| Exceptional Income | 0 | 0 | 0 | 0 |
| PBT | 401.4 | 378.4 | -5.7 | -5.7 |
| TAX | 121.1 | 62.9 | -48.1 | -48.1 |
| PAT | 280.3 | 315.4 | 12.5 | 12.5 |
| EPS | 10.46 | 11.77 | 12.5 |
| FY24 | FY25 | YOY % FY25 | CAGR % FY25 | |
|---|---|---|---|---|
| Shareholder Funds | 3111.9 | 3428.6 | 10.2 | 10.2 |
| Total Debt | 230 | 230 | 0 | 0 |
| Current Liabilities | 76.4 | 236.1 | 209 | 209 |
| Non Current Liabilities | 230 | 0 | -100 | -100 |
| Total Liabilities | 3418.3 | 3664.7 | 7.2 | 7.2 |
| Current Assets | -17253.7 | -17976.3 | 4.2 | 4.2 |
| Non Current Assets | 20672 | 21641 | 4.7 | 4.7 |
| Total Assets | 3418.3 | 3664.7 | 7.2 | 7.2 |
| FY24 | FY25 | YOY % FY25 | CAGR % FY25 | |
|---|---|---|---|---|
| Cash Flow From Operating Activities | 2154.4 | -714.4 | -133.2 | -133.2 |
| Cash Flow From Investing Activities | -2252.5 | 643.5 | -128.6 | -128.6 |
| Cash Flow From Financing Activities | 228.2 | -33.9 | -114.9 | -114.9 |
| Free Cash Flow | 2092.5 | -654.2 | -131.3 | -131.3 |
| FY24 | FY25 | YOY % FY25 | CAGR % FY25 | |
|---|---|---|---|---|
| ROE(%) | 9 | 9.2 | 2.2 | 2.2 |
| ROCE(%) | 14.4 | 10.3 | -28.5 | -28.5 |
| ROA(%) | 8.2 | 8.6 | 4.9 | 4.9 |
| Current Ratios(x) | -225.9 | -76.1 | -66.3 | -66.3 |
| Mar-25 | Jun-25 | Sep-25 | Dec-25 | QoQ % Dec-25 | YoY % Dec-25 | |
|---|---|---|---|---|---|---|
| Net Sales | 26.5 | 124.1 | 179.7 | 31.6 | -82.4 | 0 |
| Other Income | 7.4 | 2.2 | 0.6 | 1.3 | 116.7 | 0 |
| Total Income | 33.9 | 126.2 | 180.2 | 31.9 | -82.3 | 0 |
| Operating Profit | 24 | 106.2 | 164.4 | -66.4 | -140.4 | 0 |
| Interest | 1.4 | 0.2 | 2.7 | 2.4 | -11.1 | 0 |
| Depreciation | 0 | 0 | 0 | 0 | 0 | 0 |
| Total Expenditure | 11.3 | 20.2 | 18.6 | 100.8 | 441.9 | 0 |
| Exceptional Income | 0 | 0 | 0 | 0 | 0 | 0 |
| PBT | 22.6 | 106.1 | 161.6 | -68.9 | -142.6 | 0 |
| TAX | 7.2 | 25.3 | 41.1 | -9.3 | -122.6 | 0 |
| PAT | 15.5 | 80.8 | 120.5 | -59.6 | -149.5 | 0 |
| EPS | 0.58 | 3.02 | 4.5 | -2.22 | 0 | 0 |
| Type | Period / Date | Document |
|---|---|---|
| Quarterly Report | 2025-03 |
| Type | Period / Date | Document |
|---|
| Type | Period / Date | Document |
|---|
| Type | Period / Date | Document |
|---|---|---|
| Research Report | 2026-06 |
Sector - Financial Services
The financial services sector consists of a broad range of organisations that deal with the management of money. Its core segments are - Banking and Lending, Wealth and Asset Management, Insurance, and Capital Markets.
Industry - Insurance
Driven by rising incomes, financial awareness, and rapid digital adoption, India’s insurance industry is one of the fastest-growing industries. Supported by government reforms, including 100% FDI, new product approvals without IRDAI nod, and digital distribution initiatives, the industry is projected to witness substantial growth between 2025 - 2029. Today, India’s insurance industry is a dynamic mix of traditional and digital channels, innovative products, and growing private sector participation.
However, the landscape is changing rapidly. The stability that insurers have long relied on is disappearing. The past few years have been characterised by a global pandemic, political unrests, global conflicts, supply chain disruptions, and high market volatility. Artificial intelligence, predictive analytics and active risk management will shape the future of the industry. Customer needs are evolving and it is imperative that insurers keep pace.
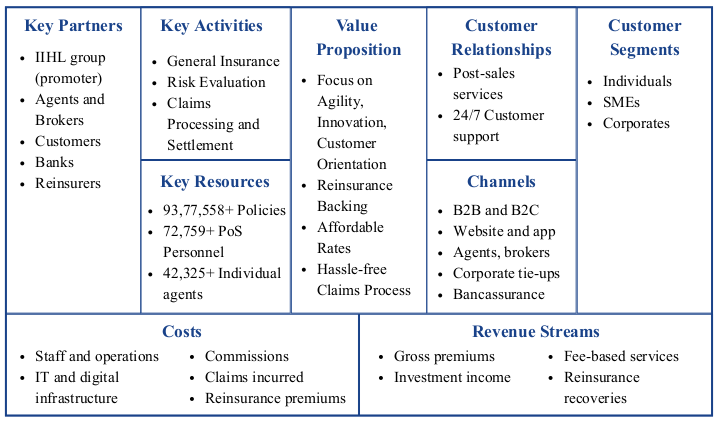
Established in 2000, Reliance General Insurance was rebranded as IndusInd General Insurance Company Limited. This change follows the acquisition of Reliance Capital (the holding company) by IndusInd International Holdings Ltd (IIHL). Headquartered in Mumbai, the company operates through 127 offices and 90,000+ intermediaries across India, with a customer base including individuals, corporates and SMEs.
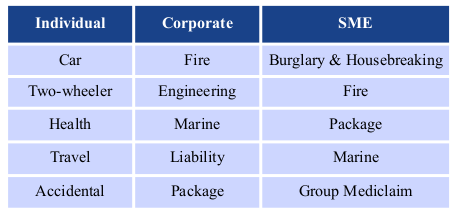
Product Portfolio:
Revenue Distribution by Business Segment (FY25): -
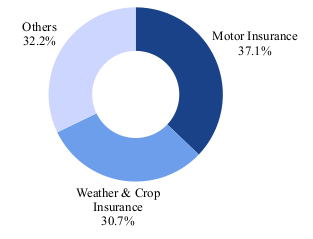
Others includes health and other corporate/retail segments.
Leadership:
Shareholding:
Key Metrics:
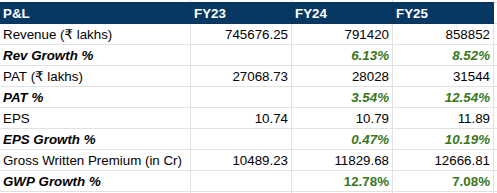
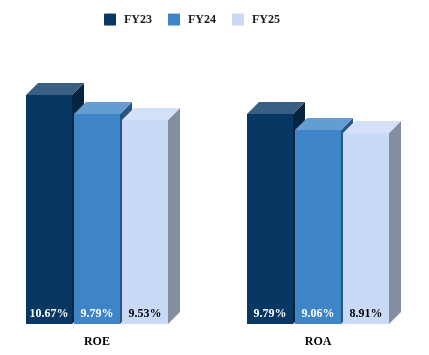
ROE and ROA have shown a declining trend, from 10.67% in FY23 to 9.53% in FY25 and from 9.79% in FY23 to 9.06% in FY25, respectively. The direction is wrong but the levels aren’t alarming.
B. Solvency Ratio
The solvency ratio measures an insurance company's financial health, indicating its ability to pay claims. Higher the ratio, greater the financial strength. IRDAI requires a minimum solvency ratio of 1.5 (150%) to ensure stability.
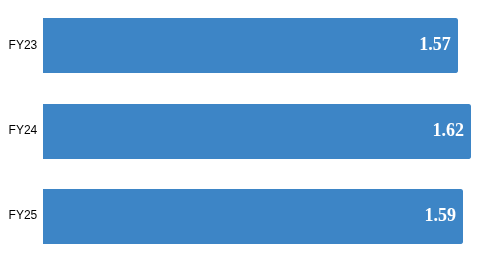
IndusInd General Insurance’s solvency ratio has shown a marginal decline over the years but it is still above the required benchmark.
C. Combined Ratio
Combined ratio indicates how profitable the company is when underwriting insurance policies. The higher the combined ratio, the less profitable the company is when underwriting insurance policies (and vice versa). A ratio above 100% implies underwriting losses.
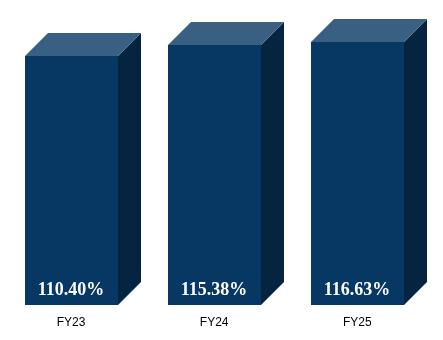
IndusInd General Insurance’s combined ratio is constantly increasing. A ratio of 116.63% implies that the company is paying out ₹1.1663 for every ₹1 of premium earned. However, it is important to note that calculation of combined ratio does not include investment income or expense. Hence, it does not necessarily mean that the company is losing money.
Methodology
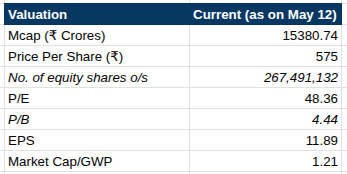
This valuation uses the Market Capitalisation to Gross Written Premium (MCap/GWP) ratio, a revenue multiple which is widely used to value general insurance companies. It measures the market value of an insurance company based on the total insurance premium generated by the company before reductions.
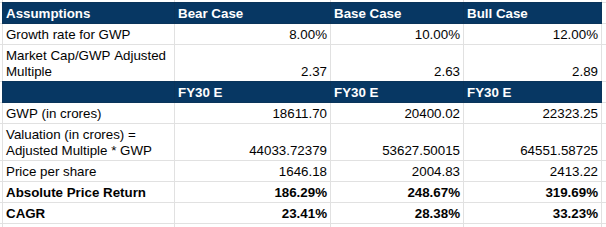
Growth Rate Assumption:
Base Case - as per data from GlobalData’s Insurance Database, non-life premiums are expected to grow at a compound annual growth rate (CAGR) of 10% between 2026 and 2030.
Bear Case - Current GWP growth rate is 7.08%. The bear case assumes the growth rate to be in the same range.
Bull Case - Historical precedent: Go Digit, Niva Bupa, and other mid-size private insurers grew at 18–22% during FY20–25 when scaling up so 12% is a conservative bull.
Market Cap/GWP Adjusted Multiple Assumption:
Analysis:
The valuation is directionally compelling but rests on three conditions - improvement in combined ratio indicating underwriting premium profitability, major turnaround in business leveraging IndusInd Bank’s resources, and growth in GWP sustains 10% CAGR.
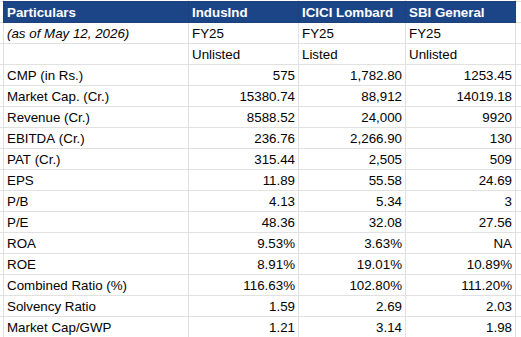
IndusInd GI is the cheapest on MCap/GWP (1.21x vs 3.14x and 1.98x), which is the entire valuation thesis. But the discount is earned, not accidental. The profitability metrics show a huge gap in margins, which flows directly from the combined ratio: 102.8% vs 116.63%. ICICI Lombard makes money underwriting; IndusInd doesn't.
ROE tells the same story. At 8.91%, IndusInd's capital productivity is less than half of ICICI Lombard's 19.01%. SBI General at 10.89% also beats it despite being unlisted and PSU-backed.
The P/E of 48x is deceptively high for a company with IndusInd's profitability profile (even higher than the sectoraverage of 37.97!). It reflects the market pricing in a future re-rating rather than current earnings quality. ICICI Lombard at 32x is actually cheaper on earnings despite being a far superior business.
ROA of 9.53% looks flattering but is inflated by the large investment portfolio relative to underwriting assets, it doesn't reflect core business efficiency.
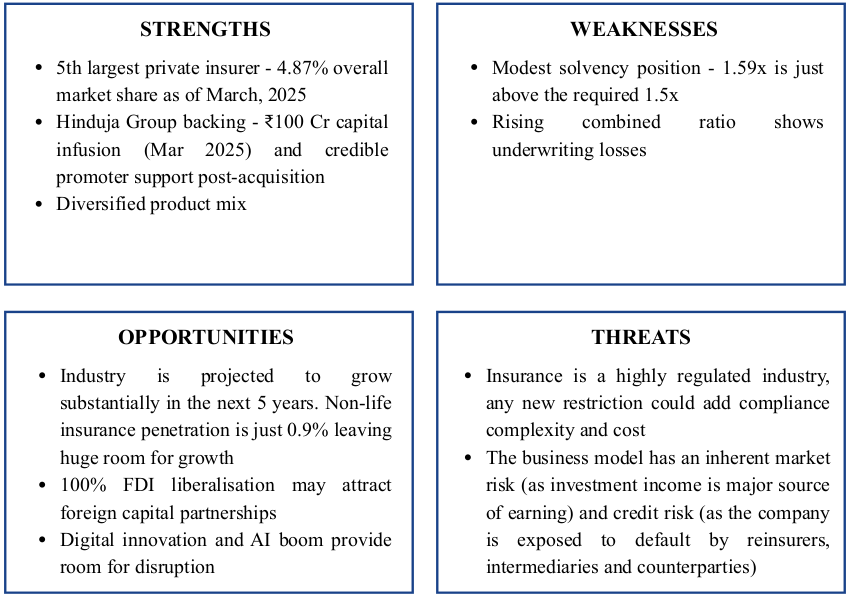
IndusInd General Insurance is a company in transition — backed by a credible promoter, growing its market share, and operating in one of the most underpenetrated non-life insurance markets globally.
At 1.21x MCap/GWP versus ICICI Lombard's 3.14x, the gap is wide — but it is justified today by a combined ratio of 116.63%, a thin solvency buffer, and a track record of investment-income-dependent profitability rather than underwriting strength.
The investment thesis is not about what the company is today — it is about what it can become. IIHL's acquisition removes the Reliance Capital overhang, opens bancassurance distribution through IndusInd Bank's network, and creates a credible path to an IPO. If the combined ratio trends toward 110% by FY27–28, GWP sustains a 10% CAGR, and the listing materialises before FY30, the base case price target of ₹2,005 per share implies a 5-year CAGR of ~28% — a return profile that is difficult to replicate in listed equities at current valuations.
IndusInd General Insurance is a high-conviction pre-IPO opportunity for patient capital with a 5-year horizon — not a trade, but a structural re-rating bet on one of India's most underpenetrated financial services segments.
Yes trading in unlisted shares is undoubtedly legal in India. The trading takes place in the over-the-counter market through various platforms like Sharescart.com.
No, SEBI does not regulate the unlisted share market but certain rules and regulations of SEBI are applicable in the unlisted market space as well, such as, the DP charges for each transaction, stamp duty, lock-in period and more.
You will get the best price for IndusInd General Insurance Company Limited and a hassle-free buying experience only on Sharescart.com platform.
IndusInd General Insurance Company Limited's unlisted shares can be easily purchased at Sharescart.com by following a few easy steps. Given below are the steps involved in the buying of these shares:
Step 1 - Confirm the number of shares you want to buy/sell of at the trading price.
Step 2 - Submit necessary documents like the Client Master Report (CMR) or additional documents (PAN, canceled cheque) if using a secondary bank account.
Step 3 - Transfer the trade amount to the account details shared by Sharescart.com.
Step 4 - Shares of will reflect in your Demat account within 24 hours after full payment (subject to holidays).
IndusInd General Insurance Company Limited's unlisted shares can be easily sold at Sharescart.com by following a few easy steps. Given below are the steps involved in the of selling of these shares:
Step 1- Confirmation on the number of shares you want to sell of IndusInd General Insurance Company Limited and at what price you want to sell.
Step 2- At Sharescart, we will find a suitable buyer for you according to your requirements and if you accept the trade we will move on to the transfer and the payment aspect of the trade.
Step 3- The Sharescart representative will provide you with the Demat account details to transfer your IndusInd General Insurance Company Limited shares. They will also notify you about the additional details required from your end before the transfer of shares such as client master copy, delivery instruction slip, and more.
Step 4- Once the transfer is complete, the payment would be credited to your bank account within 24 hours, depending on the holidays.
Over the years, the minimum ticket size for investment has dropped as more and more people have started investing in the Unlisted market. Currently, the minimum ticket size for IndusInd General Insurance Company Limited is between 52,000 to 63,000.
Brokers or dealers provide you with a trading facility means you can buy and sell shares with your broker but when you buy shares the Depository holds your shares. There are mainly two depositories NSDL and CDSL.
If you want to check your shares in NSDL and CDSL you need to download the application (NSDL Speede App or CDSL myeasi).
The taxation on the IndusInd General Insurance Company Limited shares may vary depending on 2 Factors:
Short-term capital
Unlisted shares - In unlisted shares, the taxation of short-term capital gain i.e. less than 24 months is taxable according to the investor's income tax slab.
Listed Shares - In listed shares, the taxation for short-term capital gains i.e. less than 12 months is at 20% without indexation benefits.
Long-term capital
Unlisted shares - The taxation for long-term capital gain i.e. more than 24 months is taxable at 12.5% without indexation benefits.
Listed Shares - The taxation for long-term capital gains i.e. more than 12 months is at 12.5% after an exemption of 1.25 lakh.
According to the current rule issued by SEBI last year in August 2021, the lock-in period is brought down from 1 year to 6 months. This was done to entice more investors to invest their money in pre-IPO companies and startups. The lock-in period of IndusInd General Insurance Company Limited varies depending on which type of investor you are:
You can check daily share prices of companies on our website or register with us using your phone number where you will get daily whatsapp updates on company news and other essential informations.

Buy or sell shares with confidence, backed by our research and expert guidance.

Lords Mark Industries has become the first company in India to secure BSE listing approval under the IBC’s Pre-Packa...
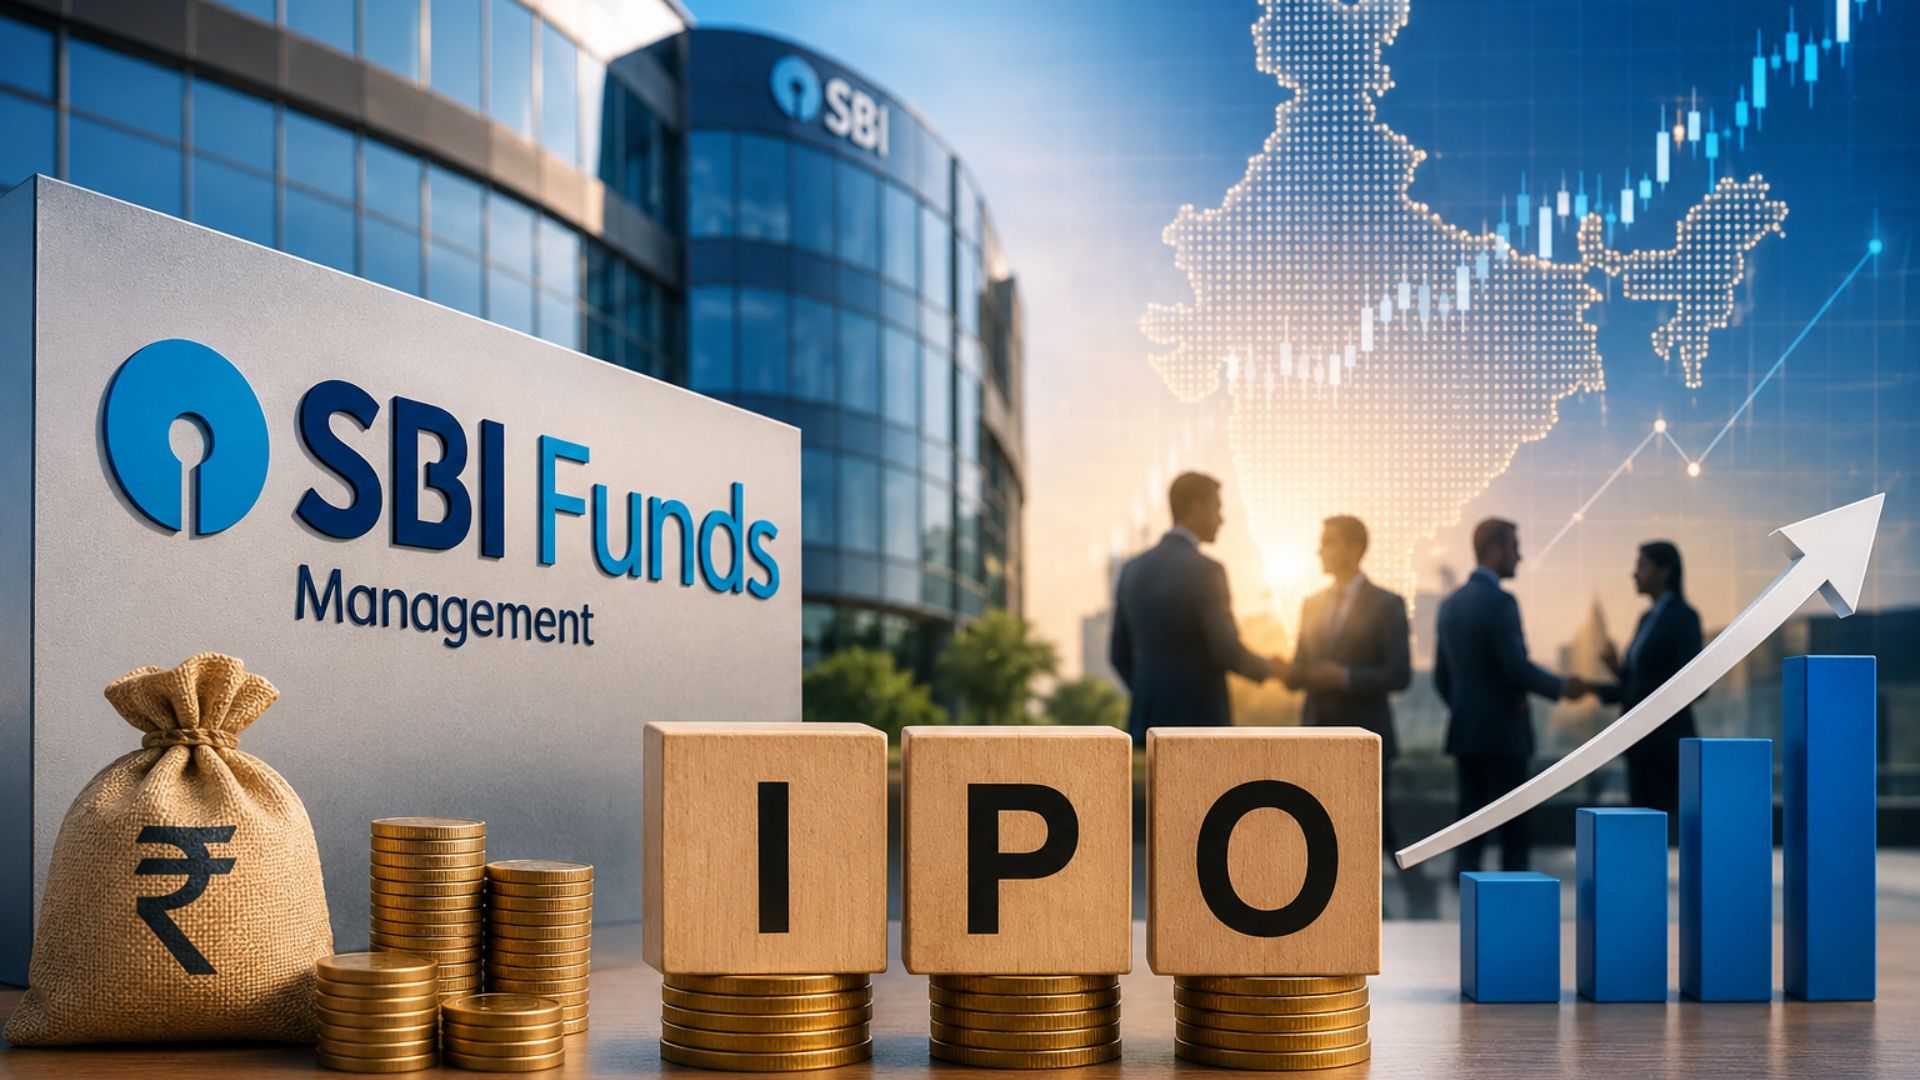
SBI Funds Management is reportedly planning a ₹13,000 crore IPO launch between June-end and July 2026 and has begun inve...

Xtranet Technologies, as part of a consortium, secured a ₹108.77 crore contract linked to Haryana’s banking modern...

Eureka Industries has initiated a Pre-Packaged Insolvency Resolution Process (PPIRP) and proposed an amalgamation with Oni...

Deeptech startup TIEA Connectors has raised ₹77 crore in a Series A round led by IvyCap Ventures, with participation fro...

NSE is expected to file its DRHP for the long-awaited IPO by the second week of June 2026, marking a major milestone in it...
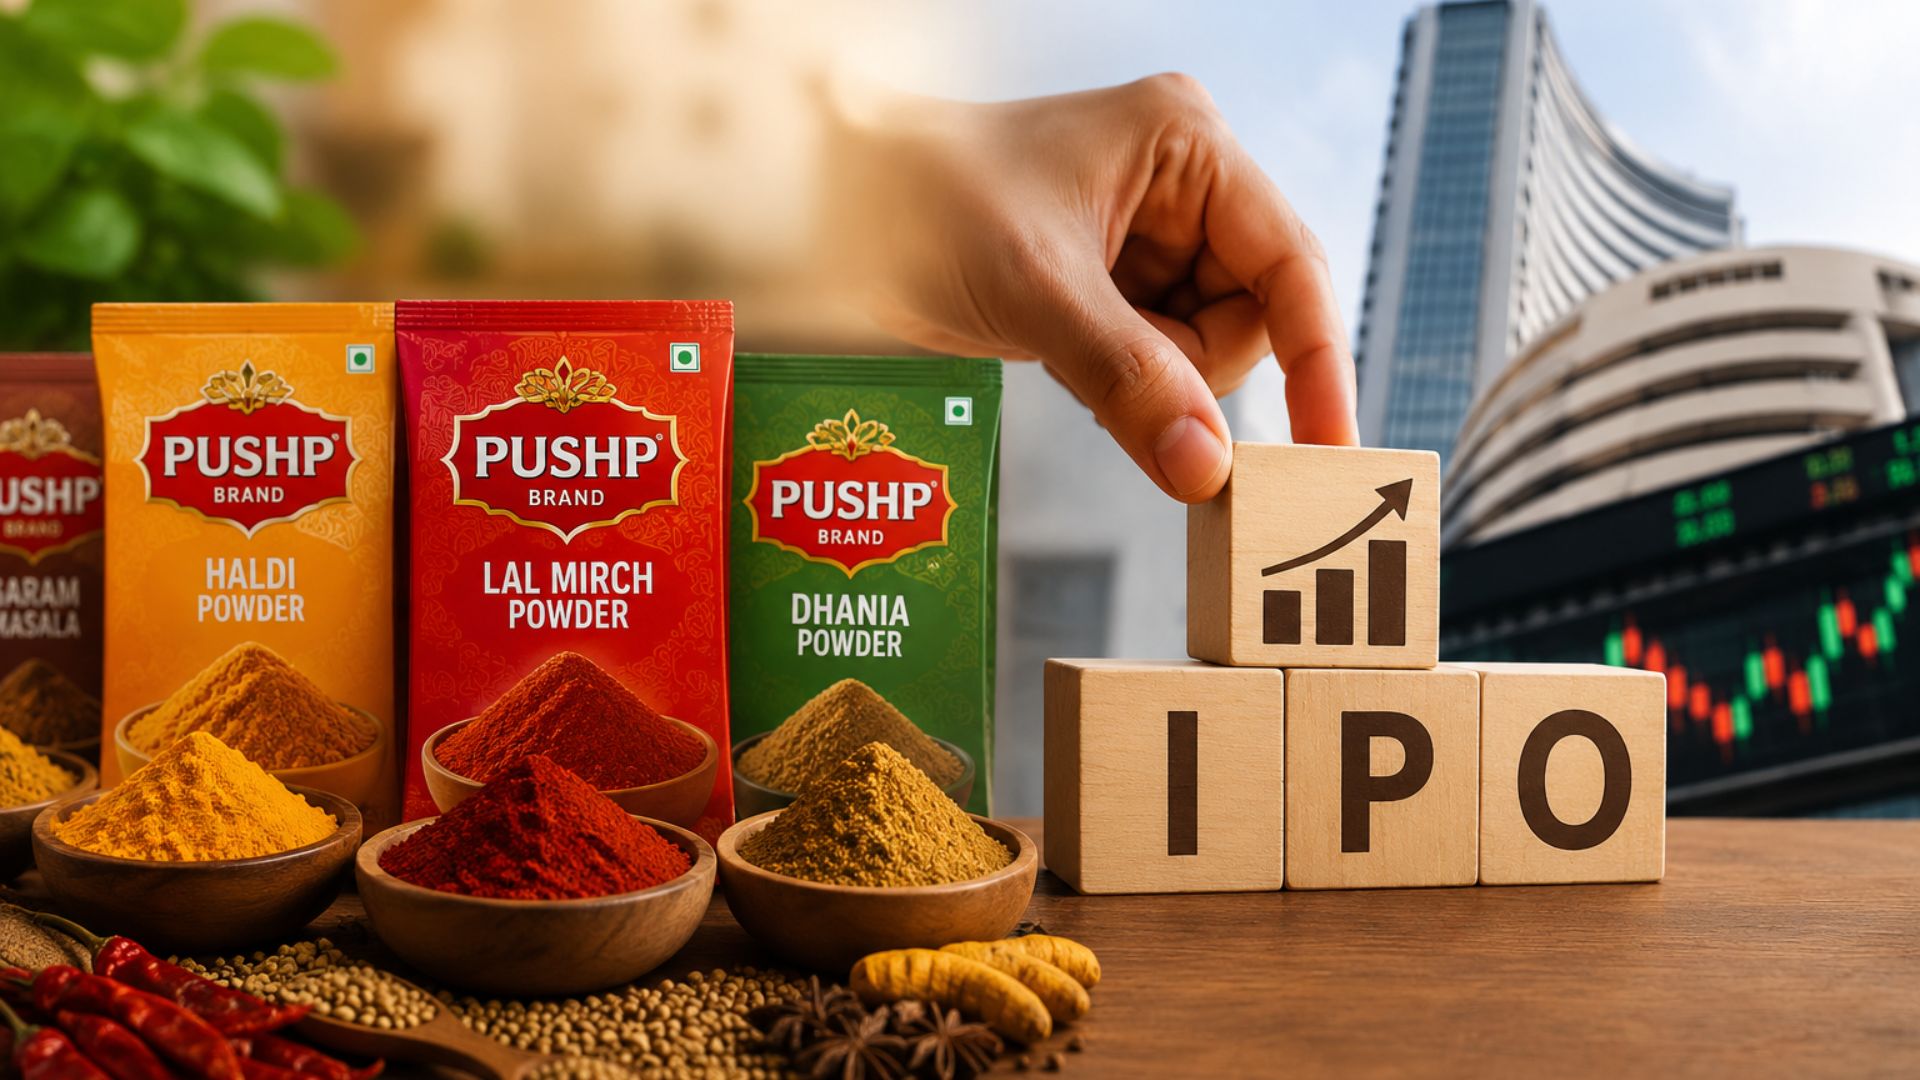
Pushp Brand India, backed by A91 Partners, has filed its DRHP with SEBI for an IPO.

Zepto filed its DRHP for a planned $1 billion IPO expected in Q2 FY27. Following this, its unlisted shares are now availab...
Slice reported its first profitable full year after becoming a bank, posting ₹48.4 Cr PAT in FY26 against a ₹217 Cr lo...

Goodluck India posted a strong Q4 FY26 with EBITDA rising 30.9% YoY to ₹121.8 Cr and PAT up 33.9% to ₹56.1 Cr.


 ChatGPT
 Claude
 Perplexity