15 Days Price Change
| FY22 | FY23 | FY24 | FY25 | FY26 | YOY % FY26 | CAGR % FY26 | |
|---|---|---|---|---|---|---|---|
| Net Sales | 4738.7 | 6401.6 | 8290.9 | 9832.7 | 9583.3 | -2.5 | 19.3 |
| Other Income | 59 | 46 | 68.8 | 70.6 | 10.2 | -85.6 | -35.5 |
| Total Income | 4797.7 | 6447.6 | 8359.7 | 9903.3 | 9593.4 | -3.1 | 18.9 |
| Operating Profit | 1457.7 | 2947.1 | 4123.9 | 4179.8 | 3766.1 | -9.9 | 26.8 |
| Interest | 1678.5 | 2174 | 3097.4 | 3827.7 | 3766.4 | -1.6 | 22.4 |
| Depreciation | 33.2 | 37.9 | 66 | 96 | 100.9 | 5.1 | 32 |
| Total Expenditure | 5051.7 | 5712.3 | 7399.2 | 9647.2 | 9668.5 | 0.2 | 17.6 |
| Exceptional Income | 0 | 0 | 0 | 0 | 26.1 | 0 | 0 |
| PBT | -254 | 735.2 | 960.6 | 256.1 | -101.2 | -139.5 | -20.6 |
| TAX | -62.1 | 255.3 | 323.5 | 146.1 | 124.8 | -14.6 | NAN |
| PAT | -191.9 | 480 | 637.1 | 110 | -226 | -305.5 | 4.2 |
| EPS | -14.8 | 37.02 | 49.14 | 8.48 | -17.44 | -305.7 |
| FY22 | FY23 | FY24 | FY25 | FY26 | YOY % FY26 | CAGR % FY26 | |
|---|---|---|---|---|---|---|---|
| Shareholder Funds | 4770 | 5247.8 | 5772 | 5760.8 | 5910.4 | 2.6 | 5.5 |
| Total Debt | 22008.7 | 26613 | 35840.4 | 40783 | 40642.4 | -0.3 | 16.6 |
| Current Liabilities | 29515.7 | 38072.2 | 47247.1 | 54109.6 | 54072.2 | -0.1 | 16.3 |
| Non Current Liabilities | 113.4 | 131.2 | 185.6 | 172.1 | 209.1 | 21.5 | 16.5 |
| Total Liabilities | 34399.1 | 43451.2 | 53204.7 | 60042.4 | 60191.6 | 0.2 | 15 |
| Current Assets | 33667.2 | 42716.9 | 52264.9 | 58901 | 59020 | 0.2 | 15.1 |
| Non Current Assets | 731.9 | 734.4 | 939.7 | 1141.4 | 1171.6 | 2.6 | 12.5 |
| Total Assets | 34399.1 | 43451.2 | 53204.7 | 60042.4 | 60191.6 | 0.2 | 15 |
| FY22 | FY23 | FY24 | FY25 | FY26 | YOY % FY26 | CAGR % FY26 | |
|---|---|---|---|---|---|---|---|
| Cash Flow From Operating Activities | -5411.6 | -7016.4 | -9238.8 | -3913.7 | 85.5 | -102.2 | NAN |
| Cash Flow From Investing Activities | 830.4 | -457.3 | -129.8 | -593.2 | -493.1 | -16.9 | NAN |
| Cash Flow From Financing Activities | 4348.8 | 7349.3 | 8717.3 | 6372.6 | -1140.9 | -117.9 | NAN |
| Free Cash Flow | -5435.5 | -7067.4 | -9381.5 | -3957.6 | 57 | -101.4 | NAN |
| FY18 | FY19 | FY20 | FY21 | FY22 | FY23 | FY24 | FY25 | FY26 | YOY % FY26 | CAGR % FY26 | |
|---|---|---|---|---|---|---|---|---|---|---|---|
| ROE(%) | 6.4 | 6.7 | 6.2 | 1 | -4 | 9.1 | 11 | 1.9 | -3.8 | -300 | NAN |
| ROCE(%) | 41 | 42.3 | 11.8 | 7.5 | 5.4 | 9.2 | 9.9 | 9 | 8.1 | -10 | -18.3 |
| ROA(%) | 1.1 | 1.2 | 1 | 0.2 | -0.6 | 1.1 | 1.2 | 0.2 | -0.4 | -300 | NAN |
| Current Ratios(x) | 1.2 | 1.2 | 1.2 | 1.2 | 1.1 | 1.1 | 1.1 | 1.1 | 1.1 | 0 | -1.1 |
| Jun-25 | Sep-25 | Dec-25 | Mar-26 | QoQ % Mar-26 | YoY % Mar-26 | |
|---|---|---|---|---|---|---|
| Net Sales | 2333.2 | 2137.4 | 2158.8 | 2110.8 | -2.2 | 0 |
| Other Income | 1.4 | 2.1 | 1.3 | 6.6 | 407.7 | 0 |
| Total Income | 2334.6 | 2139.5 | 2160.1 | 2117.4 | -2 | 0 |
| Operating Profit | 887.5 | 755.9 | 744.1 | 809.4 | 8.8 | 0 |
| Interest | 891.1 | 835.2 | 807 | 774.9 | -4 | 0 |
| Depreciation | 20.2 | 20.8 | 18.7 | 21.7 | 16 | 0 |
| Total Expenditure | 2358.3 | 2239.5 | 2241.6 | 2104.6 | -6.1 | 0 |
| Exceptional Income | 0 | 0 | 21.4 | 0 | -100 | 0 |
| PBT | -23.7 | -100 | -103 | 12.8 | -112.4 | 0 |
| TAX | 26 | 12.8 | 18.7 | 35.1 | 87.7 | 0 |
| PAT | -49.7 | -112.8 | -121.7 | -22.3 | -81.7 | 0 |
| EPS | -3.84 | -8.7 | -9.39 | -1.72 | 0 | 0 |
| Type | Period / Date | Document |
|---|---|---|
| Quarterly Report | 2026-03 | |
| Quarterly Report | 2025-12 | |
| Quarterly Report | 2025-09 | |
| Quarterly Report | 2025-06 | |
| Annual Report | 2025-03 | |
| Annual Report | 2024-03 | |
| Annual Report | 2023-03 | |
| Quarterly Report | 2022-03 | |
| Annual Report | 2022-03 | |
| Annual Report | 2021-03 | |
| Annual Report | 2020-03 | |
| Annual Report | 2019-03 | |
| Annual Report | 2018-03 |
| Type | Period / Date | Document |
|---|
| Type | Period / Date | Document |
|---|---|---|
| DRHP | 2024-03 |
| Type | Period / Date | Document |
|---|
Company Overview:
Hero FinCorp Limited (HFCL) remains a key player in India's NBFC landscape, focusing on bridging credit gaps for underserved segments, particularly in the unorganized sector, MSMEs, rural/urban middle-income groups, and retail borrowers. The company delivers "hassle-free" loans with competitive rates and minimal paperwork, emphasizing financial inclusion and upward mobility.
HFCL maintains its Representative Office in Dubai for regulatory-compliant stakeholder engagement and global opportunity exploration (no commercial activities).
HFCL catalyzes economic mobility by financing essentials like two-wheelers (driving employment/productivity) and MSME growth. Its Hero brand leverage, extensive dealer network, and digital capabilities position it to serve over 11-15 million customers, with a goal of USD 10 Billion in Assets (previously targeted for FY25, with ongoing scaling). Diversified products reduce concentration risk while addressing real credit needs ignored by traditional banks.
Business Segment:
HFCL targets MSMEs, retail, and unorganized segments via:
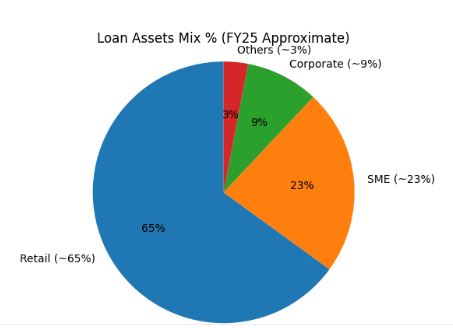
Loan Assets Mix: Retail share rose significantly (e.g., ~56-65% in recent years), reflecting strong demand in rural/urban two-wheeler and used vehicle segments.
Disciplined Credit Management: Strict LTV norms (e.g., 50-75% LAP, 75-90% two-wheelers, 1.1-3.0x corporate cover) balance growth and asset quality. Operations span India via dealer networks, with digital enhancements for efficiency.
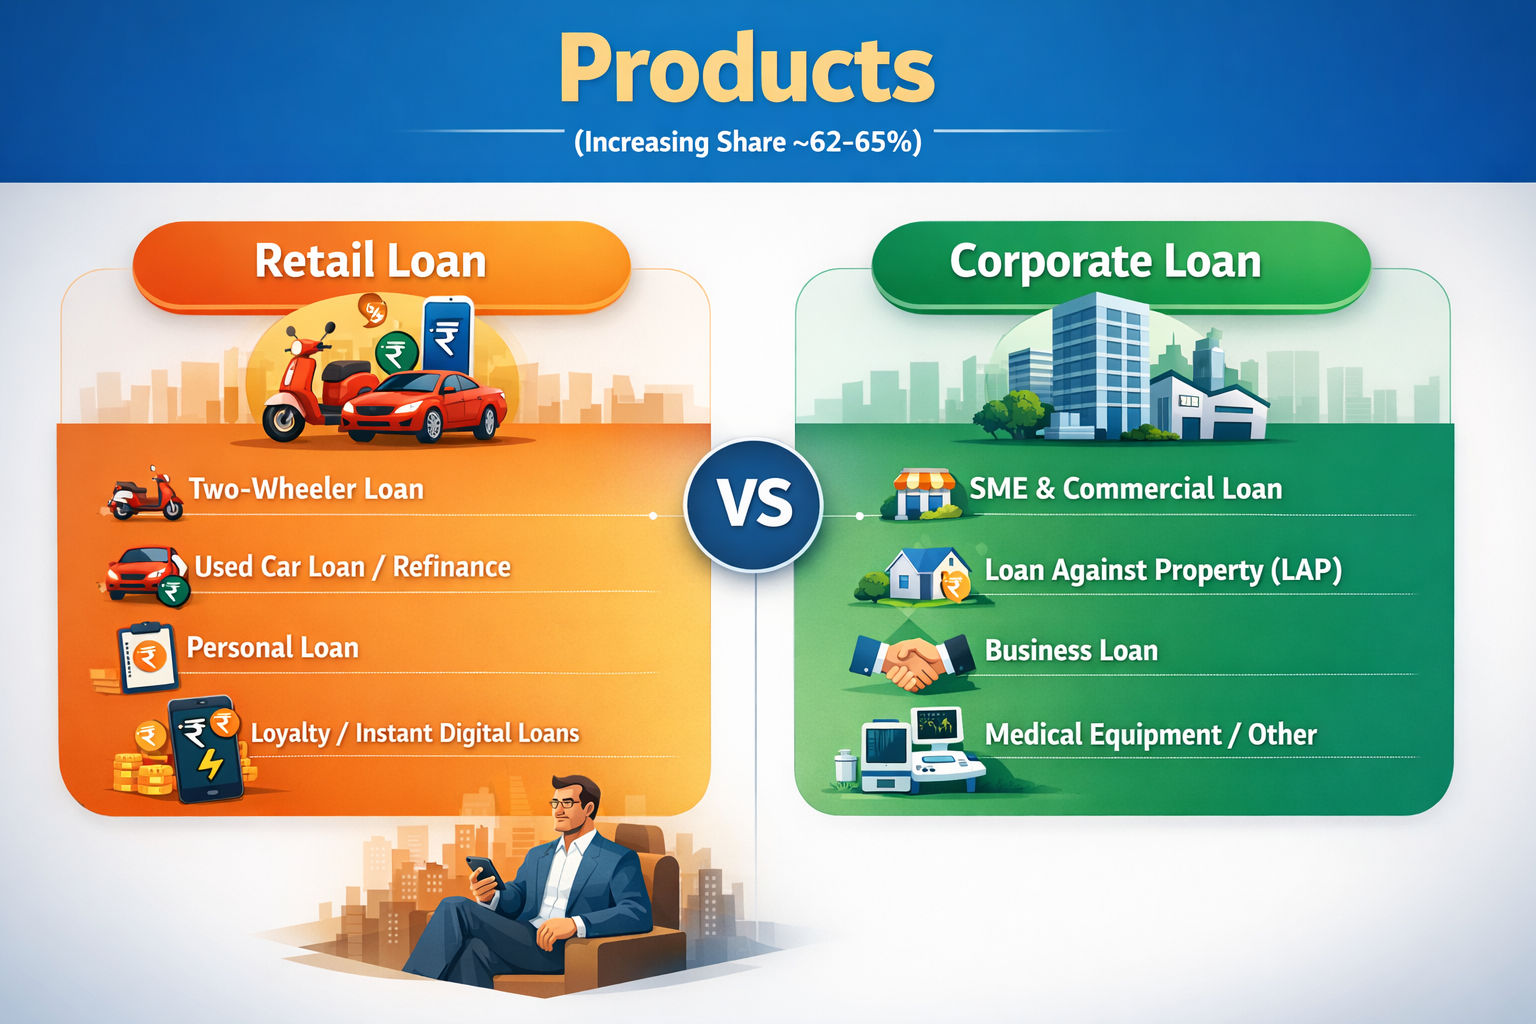
Loan Assets Mix %
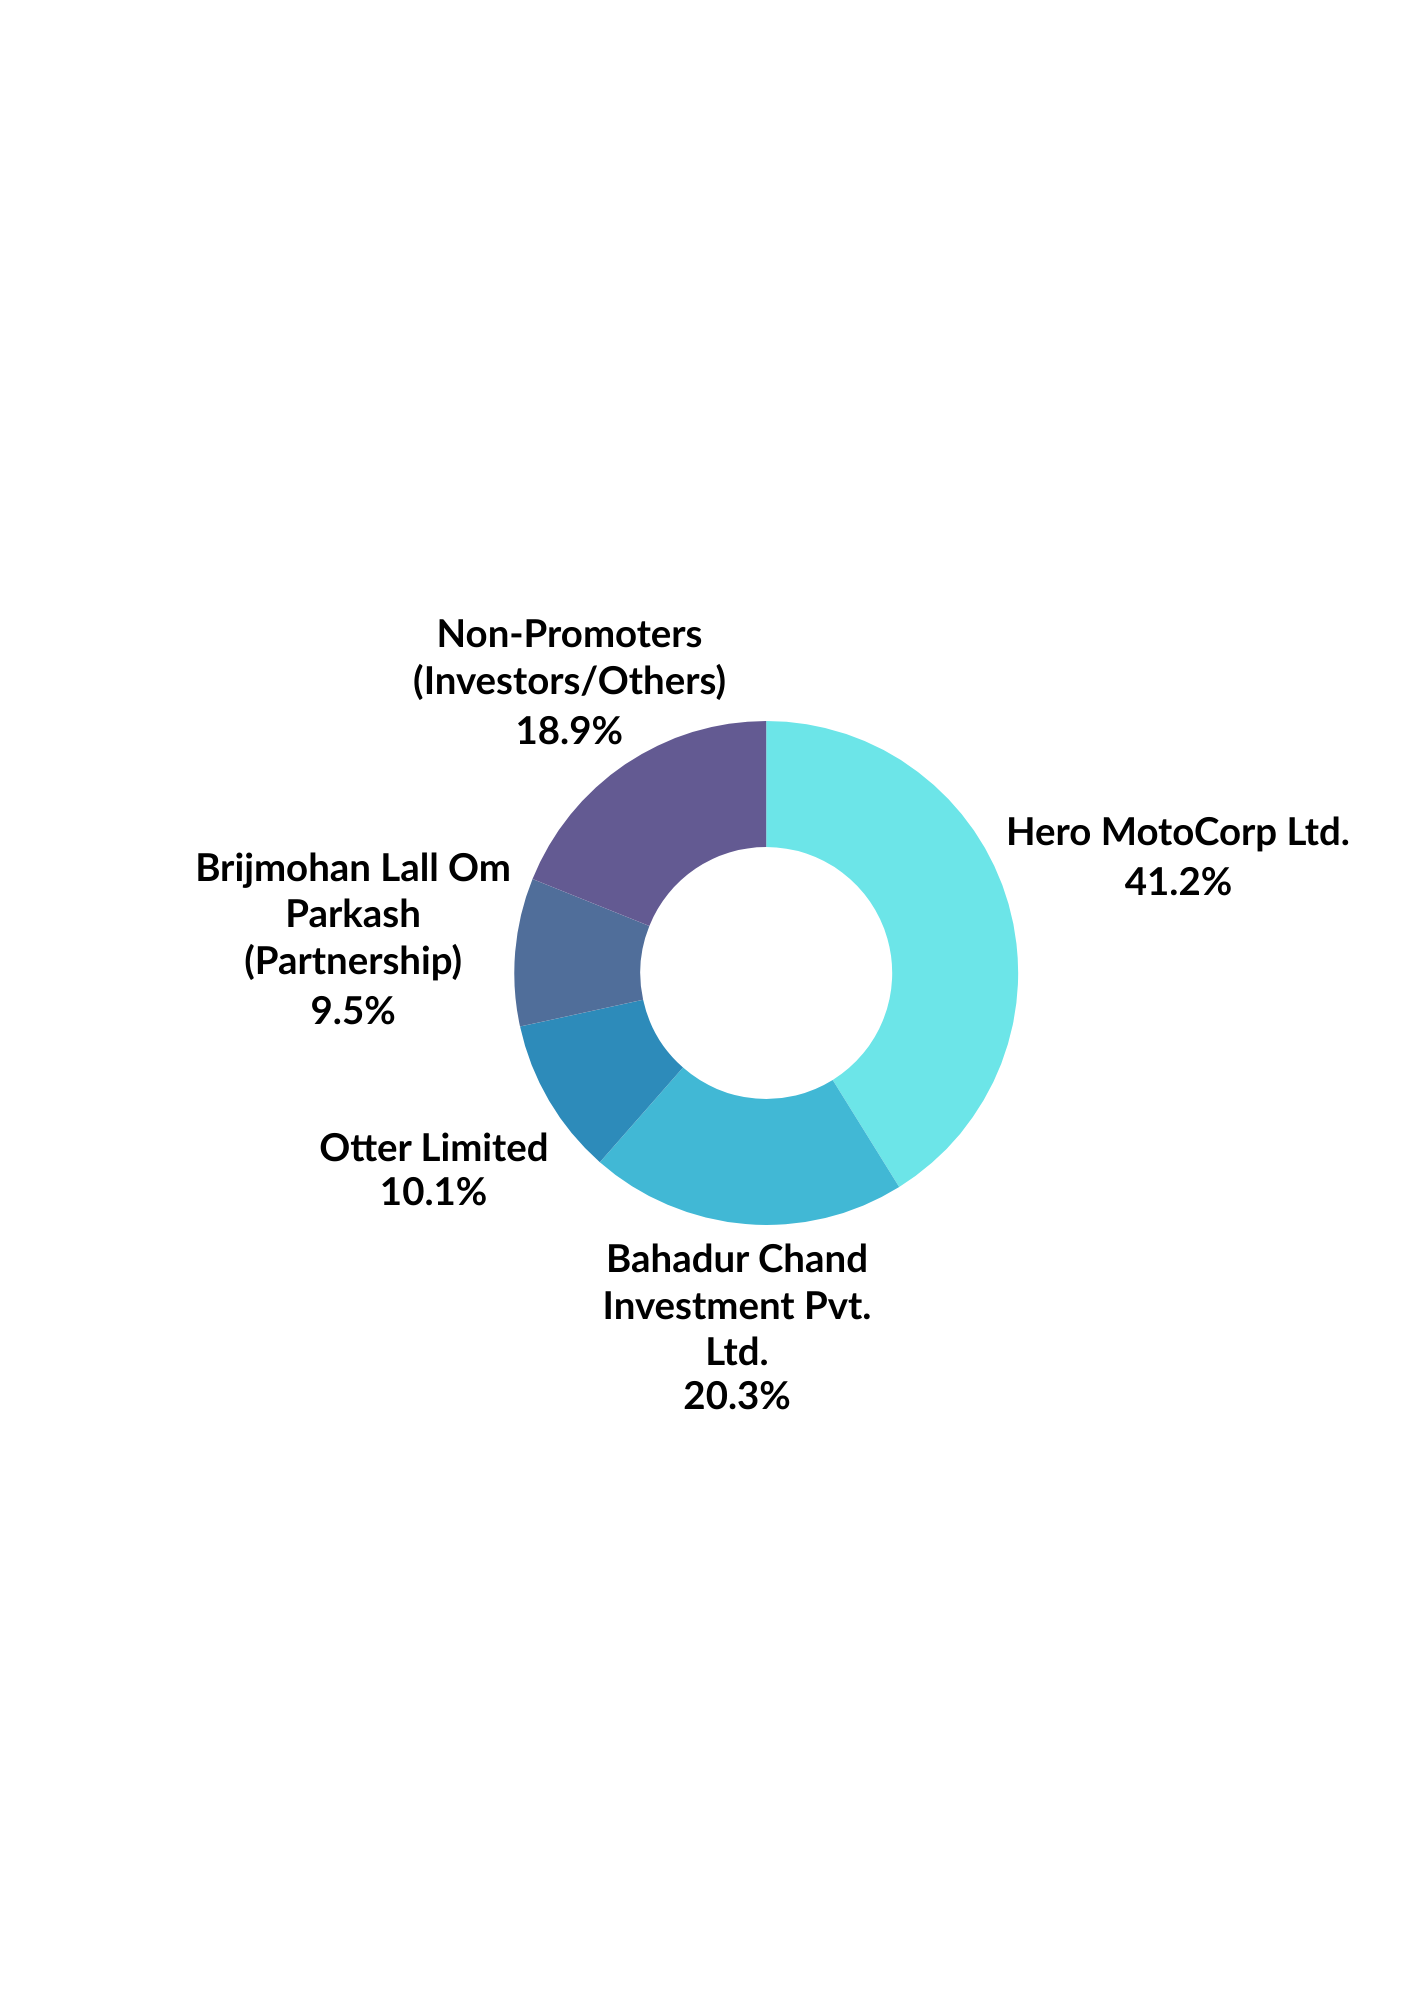
Shareholding Pattern:
Leadership Spotlight
Independent directors provide expertise in credit, governance, and economics
Source: Annual Reports
Peer Comparison:
Hero FinCorp operates in a competitive NBFC landscape, with peers like Bajaj Finance (diversified retail leader), Shriram Finance (strong in commercial/used vehicles), and Cholamandalam Investment & Finance (vehicle finance and LAP focus). Hero FinCorp lags in profitability and asset quality due to higher provisions and retail/MSME stress in FY25, but shows solid AUM scaling in underserved segments.
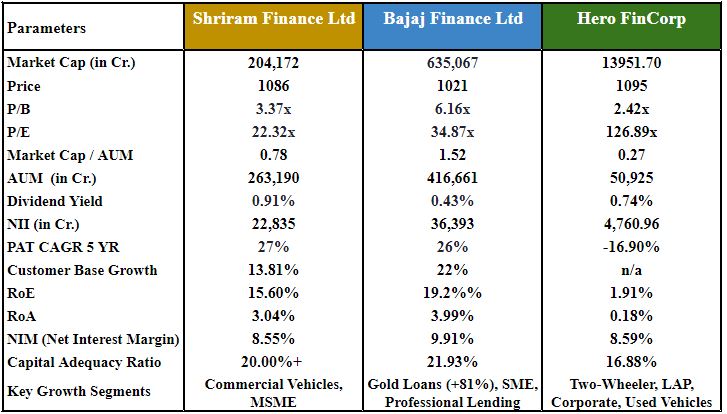
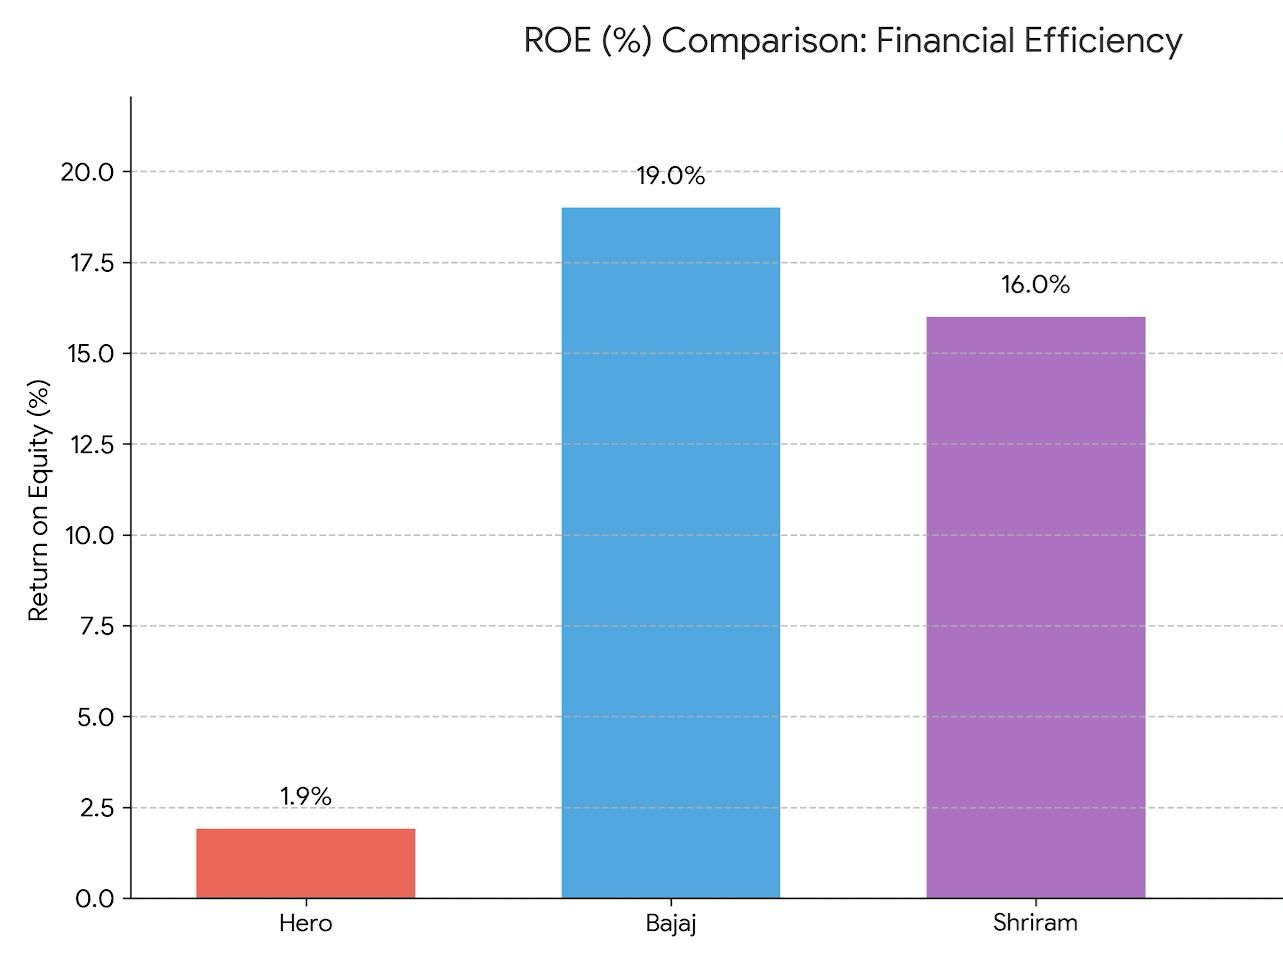
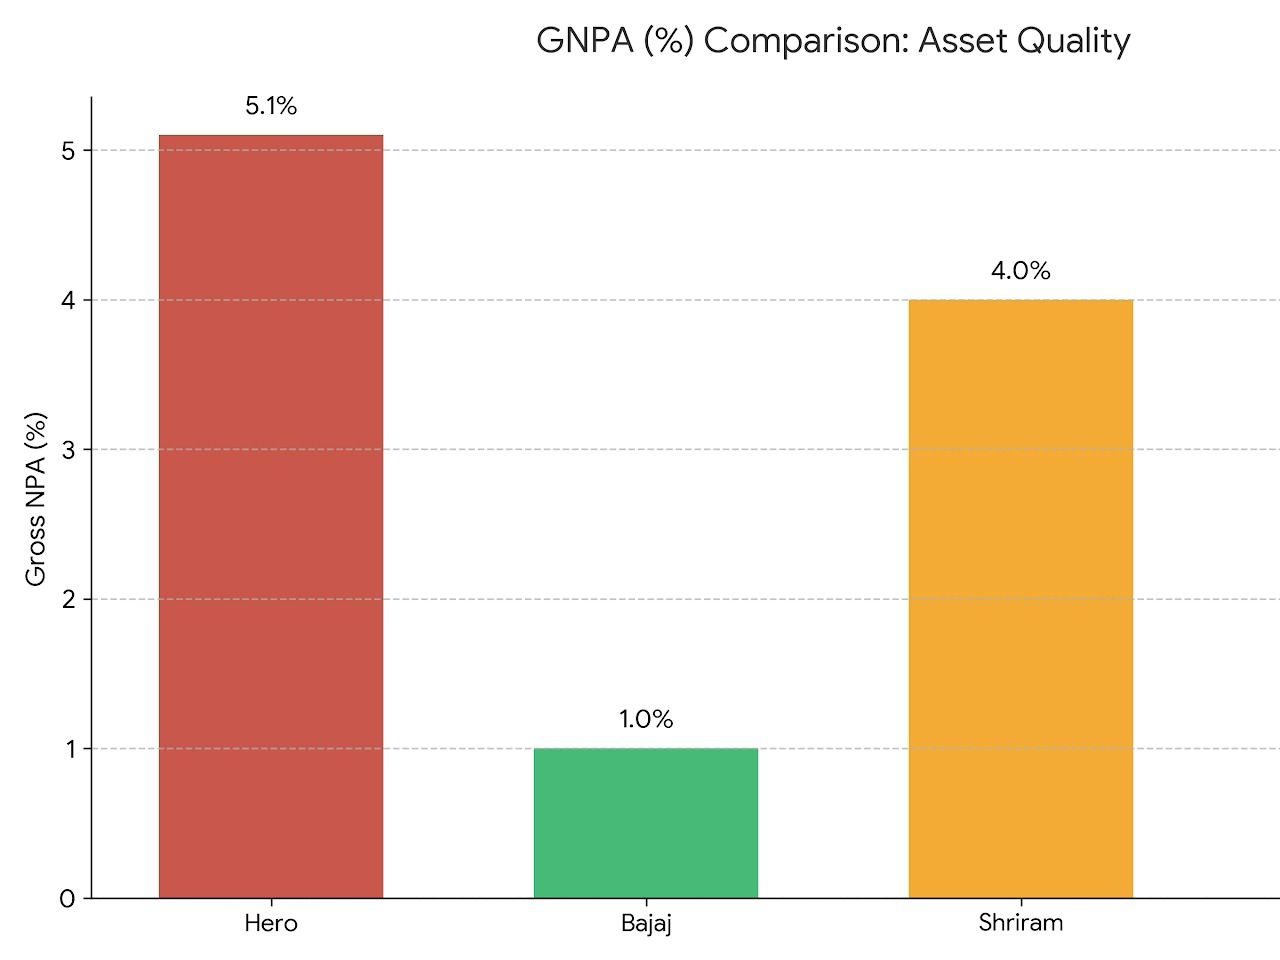
Hero FinCorp sustains growth in scale and inclusion for underserved segments, backed by Hero ecosystem and tech investments. However, FY25-early FY26 profitability and asset quality lag peers (Bajaj/Chola/Shriram show 10x+ better returns and lower GNPA). Valuation remains stretched, pricing in recovery/IPO upside.
Strengths: Brand trust, AUM scaling, retail dominance, digital edge.
Weaknesses: Earnings volatility, asset quality stress (elevated GNPA).
Opportunities: Rural/MSME expansion, digital lending, IPO capital infusion.
Threats: Margin compression, higher provisions, economic sensitivity
Financials
1. Revenue Growth and Business Expansion
Hero FinCorp has delivered strong revenue growth over the past five years, reflecting expansion in lending operations and increased demand for credit. Revenue increased from ₹4,333 crore in FY21 to ₹9,903 crore in FY25, more than doubling during the period.
The company recorded exceptional growth in FY23 (74%), followed by steady growth of 18.46% in FY24 and 15.59% in FY25, indicating sustained demand for its financial products. However, despite continued revenue expansion, profitability showed signs of stress in FY25.
2. Net Interest Income (NII) Performance
Net Interest Income (NII), the core earnings from lending activities, grew from ₹2,167 crore in FY21 to ₹4,761 crore in FY25, supported by the expansion of the loan book and higher interest-earning assets.
However, the growth rate moderated to 8.65% in FY25, compared to stronger growth of 23–38% in earlier years. This slowdown suggests pressure on lending spreads due to rising funding costs and tighter credit conditions.
3. Profitability Trends
Profitability improved significantly during FY23–FY24, with Profit After Tax (PAT) rising to ₹480 crore in FY23 and ₹637 crore in FY24, reflecting operational recovery and improved efficiency.
However, FY25 witnessed a sharp decline in profitability, with PAT falling to ₹110 crore, representing a decline of over 80%. Earnings per share also declined significantly from ₹50 in FY24 to ₹8.63 in FY25.
This indicates margin compression and potentially higher provisioning or operating costs, highlighting volatility in earnings quality.
4. AUM and Loan Book Growth
Hero FinCorp’s Assets Under Management (AUM) expanded steadily from ₹25,106 crore in FY21 to ₹50,925 crore in FY25, demonstrating strong credit demand and market penetration.
While this growth reflects the company’s expanding market presence, rapid asset expansion must be supported by effective credit risk management to maintain long-term profitability.
5. Capital Structure and Leverage
The company’s Debt-to-Equity ratio increased from 4.7x in FY21 to 8.35x in FY25, indicating a higher reliance on borrowings to fund growth.
Although leverage is typical for NBFCs, rising leverage combined with declining profitability increases financial risk, making capital efficiency and funding management critical for sustainable expansion.
6. Return Ratios and Efficiency
Return ratios weakened significantly in FY25.
Return on Equity (ROE) declined from 11.04% in FY24 to 1.91% in FY25.
Return on Assets (ROA) fell from 1.20% to 0.18%.
The sharp decline in return ratios reflects reduced profitability and lower efficiency in asset utilization, indicating short-term operational stress.
Hero FinCorp maintains scale growth and inclusion focus, but FY25-early FY26 profitability lags peers (e.g., Bajaj Finance ROE ~19%, Shriram ~15-16%). Valuation stretched on recovery hopes.
Investor Recommendation Lens:
Yes trading in unlisted shares is undoubtedly legal in India. The trading takes place in the over-the-counter market through various platforms like Sharescart.com.
No, SEBI does not regulate the unlisted share market but certain rules and regulations of SEBI are applicable in the unlisted market space as well, such as, the DP charges for each transaction, stamp duty, lock-in period and more.
You will get the best price for Hero Fincorp Limited and a hassle-free buying experience only on Sharescart.com platform.
Hero Fincorp Limited's unlisted shares can be easily purchased at Sharescart.com by following a few easy steps. Given below are the steps involved in the buying of these shares:
Step 1 - Confirm the number of shares you want to buy/sell of at the trading price.
Step 2 - Submit necessary documents like the Client Master Report (CMR) or additional documents (PAN, canceled cheque) if using a secondary bank account.
Step 3 - Transfer the trade amount to the account details shared by Sharescart.com.
Step 4 - Shares of will reflect in your Demat account within 24 hours after full payment (subject to holidays).
Hero Fincorp Limited's unlisted shares can be easily sold at Sharescart.com by following a few easy steps. Given below are the steps involved in the of selling of these shares:
Step 1- Confirmation on the number of shares you want to sell of Hero Fincorp Limited and at what price you want to sell.
Step 2- At Sharescart, we will find a suitable buyer for you according to your requirements and if you accept the trade we will move on to the transfer and the payment aspect of the trade.
Step 3- The Sharescart representative will provide you with the Demat account details to transfer your Hero Fincorp Limited shares. They will also notify you about the additional details required from your end before the transfer of shares such as client master copy, delivery instruction slip, and more.
Step 4- Once the transfer is complete, the payment would be credited to your bank account within 24 hours, depending on the holidays.
Over the years, the minimum ticket size for investment has dropped as more and more people have started investing in the Unlisted market. Currently, the minimum ticket size for Hero Fincorp Limited is between 24,000 to 29,000.
Brokers or dealers provide you with a trading facility means you can buy and sell shares with your broker but when you buy shares the Depository holds your shares. There are mainly two depositories NSDL and CDSL.
If you want to check your shares in NSDL and CDSL you need to download the application (NSDL Speede App or CDSL myeasi).
The taxation on the Hero Fincorp Limited shares may vary depending on 2 Factors:
Short-term capital
Unlisted shares - In unlisted shares, the taxation of short-term capital gain i.e. less than 24 months is taxable according to the investor's income tax slab.
Listed Shares - In listed shares, the taxation for short-term capital gains i.e. less than 12 months is at 20% without indexation benefits.
Long-term capital
Unlisted shares - The taxation for long-term capital gain i.e. more than 24 months is taxable at 12.5% without indexation benefits.
Listed Shares - The taxation for long-term capital gains i.e. more than 12 months is at 12.5% after an exemption of 1.25 lakh.
According to the current rule issued by SEBI last year in August 2021, the lock-in period is brought down from 1 year to 6 months. This was done to entice more investors to invest their money in pre-IPO companies and startups. The lock-in period of Hero Fincorp Limited varies depending on which type of investor you are:
You can check daily share prices of companies on our website or register with us using your phone number where you will get daily whatsapp updates on company news and other essential informations.

Buy or sell shares with confidence, backed by our research and expert guidance.

Consumer appliance startup Mekr Technologies has raised ₹67 crore in a Series A round led by Avaana Capital, with partic...

Indian semiconductor startup HrdWyr has raised $13 Mn (~₹108 Cr) in a Series A round led by Ideaspring Capital with part...

InCred Capital has acquired Singapore-based S Cube Capital as it strengthens its global wealth and asset management busine...

Growth91 has launched Future Unicorn, a live startup discovery platform that helps investors track startups through real-t...

Bubble tea brand Bobakat has raised ₹6 crore in a pre-Series A round to fuel expansion across India.
Swish Club has rebranded to SwishX and pivoted from IT asset leasing to AI-powered pharma solutions. The startup is buildi...

Rural-focused MFI Sindhuja Microcredit has raised $5 Mn (₹47 Cr) in a pre-Series D round from existing investors Abler N...

Jio Platforms is reportedly shifting its IPO from an OFS-led structure to a pure fresh issue, with investors like Meta and...

Zepto has received SEBI approval for its proposed IPO and is expected to raise up to $1 billion through the public issue.

Infra.Market is set to raise ₹500 Cr in a pre-IPO round at a valuation of nearly ₹25,000 Cr ($2.6 Bn), ahead of its pl...


