
The company benefits from its close partnership with Ashok Leyland which remains an important part of its business model. Vehicles from Ashok Leyland still contribute about 23 to 25 percent of the company’s assets under management which shows the strength of this captive financing relationship. At the same time the company has worked to diversify its lending. Its vehicle finance business now serves many types of borrowers including fleet operators small truck owners first time buyers and self employed transport operators.
To balance risk and returns the company manages its portfolio carefully. Commercial vehicles construction equipment and tippers together make up about 50 percent of the total loan book. Two wheelers and three wheelers account for about 11 percent. As competition increased in new vehicle financing the company shifted more focus toward used vehicle loans which now represent around 17 percent of the standalone assets under management.
Used vehicle financing offers better yields and higher interest rates because of the higher risk and depreciation is involved in it. competition in this segment is also lower because many banks lack the local expertise needed to evaluate used vehicles or manage repossession. With the support of the Hinduja Group and its strong automotive knowledge Hinduja Leyland Finance is able to assess vehicle value accurately and lend confidently in this high margin segment.
Mortgage and Housing Finance
To reduce the ups and downs of the commercial vehicle market Hinduja Leyland Finance expanded into the mortgage segment. The commercial vehicle business often depends on economic cycles and freight demand. Because of this the company wanted to build a more stable lending portfolio.
A key part of this strategy is Loan Against Property. This segment now contributes about 26 percent of the standalone assets under management. The product mainly serves self employed individuals and small businesses that need quick working capital or want to combine existing loans. Borrowers use residential or commercial property as collateral which makes the loan more secure.
Another important step was entering the affordable housing finance segment through its subsidiary Hinduja Housing Finance Limited. By March 2025 this housing business contributed around 22 percent of the total consolidated assets under management. The company mainly provides home loans to low and middle income families especially self employed borrowers in smaller cities and semi urban areas where banking access is still limited.
The housing finance business adds stability to the company’s balance sheet for several reasons:
-
Home loans are long term assets
-
Default rates in housing loans are usually lower
-
Long term loans help match long term borrowings
-
This improves the company’s asset liability balance
Another benefit is a steady income stream. Housing loans are repaid over long periods which creates predictable cash flows. This helps reduce the volatility that usually comes from shorter cycle businesses like vehicle financing. Because of this the company can maintain more balanced and stable growth.
Digital Platforms and Ancillary Ventures
As the logistics and automotive sectors in India move toward digital platforms Hinduja Leyland Finance has also started building its own digital ecosystem. The company understands that technology can improve vehicle trading financing and logistics services. To capture these opportunities it has launched platforms that support different parts of the transport and vehicle market.
One major initiative is Gaadi Mandi Digital Platforms Limited which was launched in 2022 as a wholly owned subsidiary. This platform works as a digital marketplace where people can buy and sell pre owned commercial vehicles tractors and construction equipment. The platform uses a digital bidding system that connects buyers sellers and dealers in the used vehicle market.
This platform helps the company in several ways:
-
It generates fee based income from transactions
-
It creates a strong pipeline for used vehicle loan customers
-
It helps the company sell repossessed vehicles faster
-
It improves recovery efficiency
The company also has a strategic joint venture in Gro Digital Platforms Limited. This platform works as a digital freight broker that connects cargo owners with logistics operators. Through this platform the company becomes more involved in the daily operations of transport businesses which are also its main borrowers.
These digital initiatives strengthen the company’s overall ecosystem. Customers who use these platforms are more likely to take financing from the company. At the same time the platforms generate useful data about freight activity vehicle usage and borrower cash flows. This data can help the company improve credit assessment and design better lending products in the future.
Exhaustive Industry Research and Macroeconomic Trends
-
NBFC Sector Growth
The Indian NBFC sector is going through strong growth. Retail credit demand is rising while regulations are becoming stricter and the competitive landscape is changing quickly.
-
Vehicle Finance Industry Outlook
The Indian vehicle finance market is expected to grow at a CAGR of about 15% to 17% until FY2027. Total industry assets under management may cross ₹11 lakh crore. This growth is supported by strong economic expansion infrastructure spending and increasing logistics activity.
-
Shift Toward Used Vehicle Financing
Used vehicle loans are growing faster than new vehicle loans. Pre owned vehicle financing has grown around 15% annually while new vehicle financing has grown about 11%. Higher new vehicle prices due to stricter emission and safety norms have pushed many buyers toward the used vehicle market.
-
Opportunity for NBFCs
NBFCs are well positioned to capture this segment because they have stronger local market knowledge and flexible underwriting models. The share of used vehicles in NBFC loan books may reach about 41% by March 2027.
-
Rural Credit Opportunity
Rural India contributes nearly 47% of the country’s GDP but receives only about 8% of banking credit. NBFCs are filling this credit gap because they can operate efficiently in smaller towns and rural regions.
-
Electric Vehicle Financing
The shift toward electric vehicles is creating a new financing opportunity. Government schemes such as PM E DRIVE with an outlay of ₹10900 crore are encouraging EV adoption especially for two wheelers and three wheelers.
-
Regulatory Framework for NBFCs
The Reserve Bank of India has introduced a Scale Based Regulation framework. NBFCs are classified into different layers based on their size and systemic importance.
-
Position of Hinduja Leyland Finance
Hinduja Leyland Finance falls under stricter regulatory supervision because of its scale. While compliance costs are higher the framework strengthens financial stability and allows well governed NBFCs to capture a larger share of the credit market.
Promoters and the Hinduja Group Ecosystem
The reputation and credit strength of Hinduja Leyland Finance come largely from the backing of the Hinduja Group. The group has been operating for more than a hundred years and has businesses in banking automotive and financial services. Because of this long history the company enjoys strong credibility in the market. As of FY2025 the promoter group owns about 74.5 percent of the company. Ashok Leyland holds the largest share at about 61.12 % while Hinduja Automotive owns roughly 12.7 to 12.9 %.
Hinduja Leyland Finance also works very closely with Ashok Leyland. The NBFC finances around 8 to 11 percent of the vehicles sold by the manufacturer. This support becomes especially useful when liquidity in the financial system becomes tight. At the same time the finance company benefits from access to Ashok Leyland’s large dealer network across the country. This makes it easier to find customers and reduces the cost of sourcing loans.
Furthermore, the company has been financially supported by its parent group through the provision of new funds at various times throughout the life of the cooperative business model. During FY2025, Ashok Leyland obtained ₹2 billion of investment via a preferential equity share offering made by its parent group (Hinduja Group). This enabled Ashok Leyland to strengthen its SACR ratio, allowing it to continue growing its loan portfolio.
Lastly, there is significant representation of the Hinduja group at both executive management and Board levels of Ashok Leyland. Dheeraj G Hinduja serves on the Board as Chair; Sachin Pillai functions as MD & CEO/Managing Director. Therefore, having a high level of involvement from major shareholders provides additional assurance to shareholders that Ashok Leyland is positioned as a stable business and one that will grow into the future.
Shareholding pattern of hinduja leyland finance
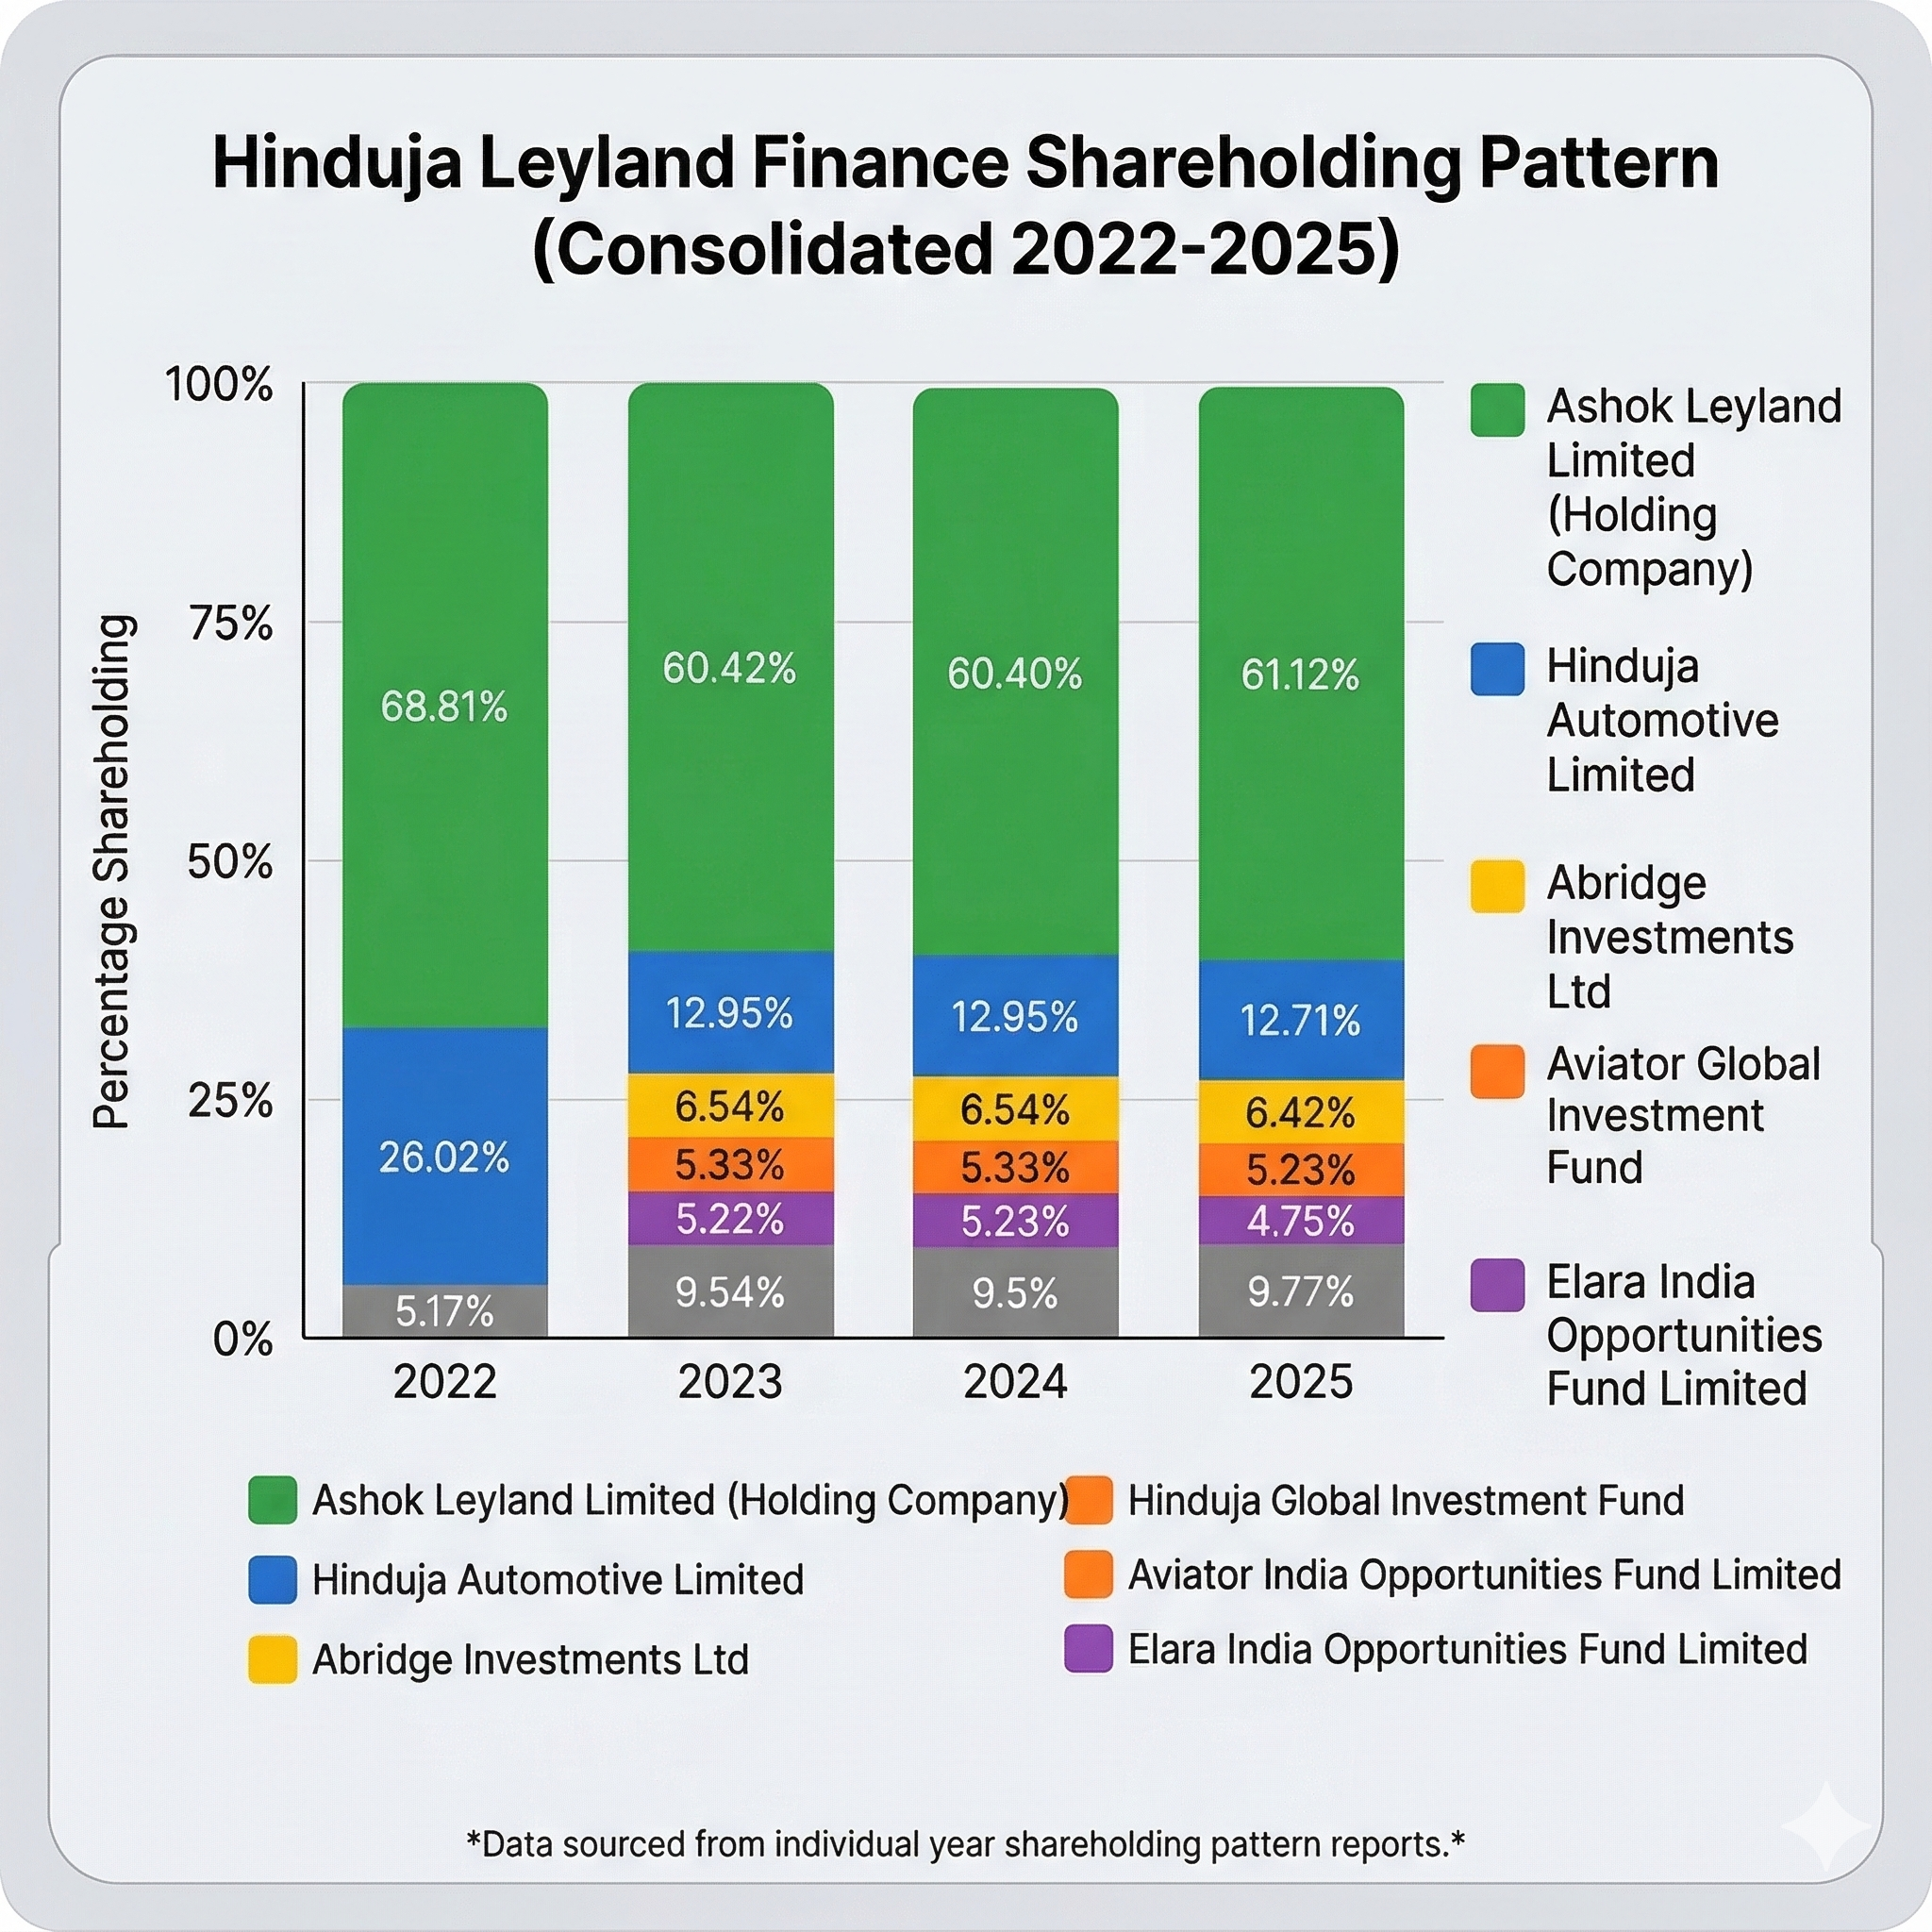
The ownership structure of Hinduja Leyland Finance shows strong promoter control along with participation from institutional investors. As of FY2025 Ashok Leyland Limited remains the largest shareholder with a stake of 61.12 percent, making it the primary holding company. Another group entity Hinduja Automotive Limited holds 12.71 percent of the company.
Apart from the promoter group several institutional investors also hold meaningful stakes. Abridge Investments Ltd owns 6.42 percent, while Aviator Global Investment Fund holds 5.23 percent. Elara India Opportunities Fund Limited has a stake of 4.75 percent in the company. The remaining 9.77 percent is held by other investors.
The ownership structure demonstrates the backing of the Hinduja Group as well as the confidence from institutional investors regarding the company's growth potential over time.
Corporate Restructuring: The NDL Ventures Merger and Value Unlocking
The most important development for Hinduja Leyland Finance today is its planned reverse merger with NDL Ventures Limited. This move will bring the large unlisted NBFC into the public stock market. The goal is to unlock shareholder value and simplify the Hinduja Group’s corporate structure.
Earlier the company planned to raise capital through an IPO. Later the management chose a merger route which is faster and more efficient than a traditional listing process.
NDL Ventures Limited which was earlier called NXTDIGITAL Limited is a listed company within the Hinduja Group. After selling its media business to Hinduja Global Solutions the company remained listed but had no major operating business. This made it an ideal vehicle for merging Hinduja Leyland Finance and taking the business public.
The boards of both companies approved the merger in late 2025. Since then key approvals have been received. The Reserve Bank of India gave its No Objection Certificate in August 2025 and the Competition Commission of India approved the deal on February 17 2026. The merger is expected to take effect from April 1 2026 after final approvals from regulators and exchanges. Source
A major part of the deal is the share swap ratio. Shareholders of Hinduja Leyland Finance will receive 25 shares of NDL Ventures for every 10 shares they hold.
Because of this structure the market price of NDL Ventures now acts as a reference for valuing the unlisted shares of Hinduja Leyland Finance. For investors this merger creates a clear path to public market liquidity and reduces the uncertainty usually seen in the unlisted share market.
Exhaustive Financial Performance Analysis
The financial data up to March 2025 shows that Hinduja Leyland Finance has been growing steadily while keeping profitability stable and asset quality under control.
The loan book has increased strongly over the last few years. Advances were ₹21,766 crore in FY2022. They rose to ₹28,415 crore in FY2023 and then to ₹38,463 crore in FY2024. By FY2025 advances reached ₹47,854 crore. The gradual increase in vehicle financing and retail lending indicates that the company is establishing its foothold in these areas.In addition, the increased lending has also increased revenues for the company. The gross interest revenue grew from ₹2,780 crore for FY 2022 to ₹3,113 crore for FY 2023. Gross interest revenue grew further from ₹4,010 crore for FY 2024 to ₹5,364 crore in FY 2025. The growth in other income represents a significant increase as well, from ₹319 crore to ₹917 crore, which indicates increasing fee income. With the growth of the loan book, the company's cost of borrowing increased as well; gross interest expenses increased from ₹1,534 crore for FY 2022 to ₹3,540 crore for FY 2025. The company's operating expenses increased as the company expanded its branch network from ₹369 crore to ₹1,043 crore. Even though the total cost of operations has increased, the company's net profit after tax has increased as well; net profit after tax was ₹341 crore in FY 2022 and increased to ₹489 crore in FY 2023.
It reached ₹636 crore in FY2024 and rose to ₹774 crore in FY2025. Earnings per share also doubled from ₹7.26 to ₹14.2 during this period.
Asset quality also improved. Gross NPA moved from 4.2 percent in FY2022 to 4.87 percent in FY2023 but later declined to 4.3 percent in FY2024 and fell further to 3.63 percent in FY2025. Net NPA improved to 2.13 percent which shows better recovery and risk management.
The balance sheet has also strengthened. Book value per share increased from ₹87.32 in FY2022 to ₹159.48 in FY2025. Return on equity stayed around 8 to 9 percent. The price to book ratio declined from 2.5 to about 1.37 which may indicate potential valuation upside if the company continues to grow.
Financials ( Figures in Cr )
P&L Statement
| P&L Statement | 2022 | 2023 | 2024 | 2025 |
|---|---|---|---|---|
| Interest Earned | 2780 | 3113 | 4010 | 5364 |
| Other Income | 319 | 388 | 649 | 917 |
| Interest Expended | 1534 | 1721 | 2561 | 3540 |
| Operating Expenses | 369 | 456 | 632 | 1043 |
| Provisions and Contingencies | 747 | 646 | 572 | 652 |
| PAT | 341 | 489 | 636 | 774 |
| EPS | 7.26 | 9.14 | 11.88 | 14.2 |
| Gross NPA | 4.2 | 4.87 | 4.3 | 3.63 |
| Net NPA | 2.8 | 3.34 | 2.7 | 2.13 |
Financial Ratios
| Financial Ratios | 2022 | 2023 | 2024 | 2025 |
|---|---|---|---|---|
| Advances | 21766 | 28415 | 38463 | 47854 |
| Book Value | 87.32 | 104.63 | 127.25 | 159.48 |
| P / B | 2.5 | 2.68 | 2.2 | 1.37 |
| ROE (%) | 8.31 | 8.74 | 9.34 | 8.9 |
| Assets | 2022 | 2023 | 2024 | 2025 |
|---|---|---|---|---|
| Fixed Assets | 84 | 106 | 358 | 535 |
| Cash and Balances | 850 | 1266 | 3211 | 3683 |
| Investments | 1191 | 1828 | 1921 | 3254 |
| Advances | 21766 | 28415 | 38463 | 47854 |
| Other Assets | 585 | 804.02 | 924.16 | 1206 |
| Total Assets | 24476 | 32419.02 | 44877.16 | 56532 |
Liabilities
| Liabilities | 2022 | 2023 | 2024 | 2025 |
|---|---|---|---|---|
| Share Capital | 469.89 | 535.02 | 535.16 | 545.24 |
| FV | 10 | 10 | 10 | 10 |
| Reserves | 3633 | 5063 | 6275 | 8150 |
| Borrowings | 18335 | 24891 | 35029 | 42661 |
| Deposits | 0 | 0 | 0 | 0 |
| Other Liabilities | 2038.11 | 1930 | 3038 | 5175.76 |
| Total Liabilities | 24476 | 32419.02 | 44877.16 | 56532 |
Cash flow statement
| Cash Flow Statement | 2022 | 2023 | 2024 | 2025 |
|---|---|---|---|---|
| PBT (%) | 449 | 652 | 841 | 1040 |
| OPBWC | -865 | -348 | -426 | -598 |
| Term Deposit | 0 | 0 | 0 | 0 |
| Change in Investment | 0 | 0 | 0 | 0 |
| Change in Advances | -777 | -7139 | -9721 | -8631 |
| Change in Deposit | 0 | 0 | 0 | 0 |
| Other Changes | 1344 | 1190 | 1598 | 1846 |
| Working Capital Change | 567 | -5949 | -8123 | -6785 |
| Cash Generated From Operations | -298 | -6297 | -8549 | -7383 |
| Tax | -108 | -124 | -185 | -164 |
| Cash Flow From Operations | -190 | -6173 | -8364 | -7219 |
| Purchase of PPE | -3 | -16 | -269 | -212 |
| Sale of PPE | 0 | 0 | 0 | 0.3 |
| Purchase of Investment | 0 | -849 | -537 | -2481 |
| Sale of Investments | 0 | 34 | 385 | 1143 |
| Others | 45 | 0 | 2 | -186.3 |
| Cash flow from Investment | 42 | -831 | -419 | -1736 |
| Proceeds from Borrowing | -7467 | 13309 | 20208 | 21071 |
| Repayment of Borrowing | 7198 | -6966 | -9561 | -10608 |
| Dividend | 0 | 0 | 0 | 0 |
| Proceeds from Equity | 0.48 | 11.25 | 0.8 | 200.59 |
| Others From Financing | 408.52 | 886 | 0 | -1435.59 |
| Cash Flow from Financing | 140 | 7240.25 | 10647.8 | 9228 |
| Net Cash Generated | -8 | 236.25 | 1864.8 | 273 |
| Cash at the Start | 819 | 810 | 1045 | 2909 |
| Cash at the End | 811 | 1046.25 | 2909.8 | 3182 |
Peer Comparison and Relative Valuation
To understand the relative value of Hinduja Leyland Finance it is useful to compare it with other listed NBFCs that operate in the vehicle and asset finance segment. Some of the key peers in this space are Shriram Finance Limited Sundaram Finance Limited and Cholamandalam Investment and Finance Company Limited.
Shriram Finance Limited is one of the largest players in used commercial vehicle financing in India. The company operates at a very large scale with assets under management of about ₹2.81 lakh crore. Because of its strong presence in rural markets and its long operating history the company benefits from large economies of scale. In the public market Shriram Finance trades at a price to earnings multiple of about 21 to 22 times and a price to book ratio close to 3.4 times. The company also maintains a strong return on equity of around 17 percent which supports its premium valuation.
Sundaram Finance Limited is known for its very conservative lending approach and strong asset quality. Its gross stage three assets are around 1.44 percent which shows high credit discipline. Even though the company operates at a smaller scale with assets under management of about ₹51,476 crore the market values its stability and long reputation very highly. Sundaram Finance trades at a price to earnings multiple of around 30 times and a price to book ratio above 4 times. The company usually delivers return on equity in the range of about 14 to 16 percent.
| Financial Institution | Listing Status | AUM (₹ Cr) | Implied P/E Ratio | Implied P/B Ratio | ROE (%) |
| Hinduja Leyland Finance | Unlisted | 61,692 | ~16.5x | ~1.5x | ~8.9% |
| Shriram Finance | Listed | 2,81,309 | ~21.7x | ~3.4x | ~16.9% |
| Sundaram Finance | Listed | 51,476 | ~30.3x | ~4.1x | ~16.3% |
| Cholamandalam Inv. | Listed | >1,40,000 | ~30.6x | ~5.5x | ~18.0% |
Cholamandalam Investment and Finance Company is another major NBFC backed by the Murugappa Group. The company is known for its strong growth strategy and rapid expansion in both vehicle finance and mortgage lending. Because of its high growth profile the market assigns it a higher valuation. Cholamandalam trades at a price to earnings multiple close to 30 times and a price to book ratio of around 5.5 times. The company also maintains a strong return on equity of about 18 percent which supports this premium market valuation
Unlisted Market Dynamics and Trading Parameters
The unlisted shares of Hinduja Leyland Finance have started gaining strong interest from portfolio managers family offices and investors who specialize in unlisted equity. The shares have an ISIN number INE146O01014 and the face value of each share is ₹10. These shares are traded in the secondary market through demat transfers using the NSDL and CDSL depositories. Depending on the broker the minimum investment usually starts from around 100 shares while some deals are done in larger blocks of about 1000 shares which allows both small and large investors to participate.
The share price movement over the past year reflects growing confidence in the upcoming merger with NDL Ventures. Earlier the shares were trading close to ₹200 to ₹210 which acted as a support level. As regulatory approvals started coming in the price gradually moved higher and reached the range of about ₹240 to ₹265.
The final value of these shares will largely depend on the merger swap ratio with NDL Ventures. According to the approved structure shareholders of Hinduja Leyland Finance will receive 25 shares of NDL Ventures for every 10 shares they hold. Because of this investors closely track the market price of NDL Ventures which is a listed company. By observing its price investors can estimate the potential value of Hinduja Leyland Finance shares and identify opportunities before the expected listing around April .