15 Days Price Change
| FY21 | FY22 | FY23 | FY24 | FY25 | YOY % FY25 | CAGR % FY25 | |
|---|---|---|---|---|---|---|---|
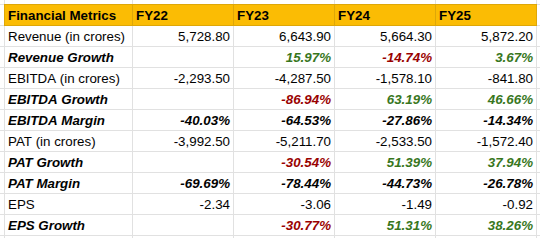
| Net Sales | 2335.3 | 5728.8 | 6643.9 | 5664.3 | 5872.2 | 3.7 | 25.9 |
| Other Income | 25.4 | 52.2 | 55.8 | 94.7 | 107.9 | 13.9 | 43.6 |
| Total Income | 2360.7 | 5781 | 6699.8 | 5758.9 | 5980 | 3.8 | 26.2 |
| Operating Profit | -569.3 | -2293.5 | -4287.5 | -1578.1 | -841.8 | -46.7 | 10.3 |
| Interest | 43.4 | 258.3 | 665.5 | 727.9 | 506.1 | -30.5 | 84.8 |
| Depreciation | 32.9 | 158.8 | 243.4 | 216 | 169 | -21.8 | 50.5 |
| Total Expenditure | 2904.6 | 8491.6 | 8974 | 7254.8 | 7208.6 | -0.6 | 25.5 |
| Exceptional Income | 0 | -1267.1 | 0 | 0 | 0 | 0 | 0 |
| PBT | -620.3 | -3970.8 | -5196.5 | -2522 | -1516.9 | -39.9 | 25.1 |
| TAX | 21.1 | 21.7 | 15.2 | 11.5 | 55.5 | 382.6 | 27.4 |
| PAT | -641.3 | -3992.5 | -5211.7 | -2533.5 | -1572.4 | -37.9 | 25.1 |
| EPS | -0.38 | -2.34 | -3.06 | -1.49 | -0.92 | -38.3 |
| FY21 | FY22 | FY23 | FY24 | FY25 | YOY % FY25 | CAGR % FY25 | |
|---|---|---|---|---|---|---|---|
| Shareholder Funds | 3581.2 | 7022.5 | 2436.9 | 2588.3 | 3272.3 | 26.4 | -2.2 |
| Total Debt | 5.3 | 2585.4 | 4120 | 4098.4 | 2033.7 | -50.4 | 342.6 |
| Current Liabilities | 111.2 | 3761.6 | 2323.2 | 3502.5 | 1781.2 | -49.1 | 100.1 |
| Non Current Liabilities | 7.4 | 614.2 | 3496.3 | 2298.9 | 1923.1 | -16.3 | 301.5 |
| Total Liabilities | 4905.3 | 11398.3 | 8256.4 | 8389.7 | 6976.6 | -16.8 | 9.2 |
| Current Assets | 1735.5 | 2502.2 | 2534.9 | 3476.3 | 2512.6 | -27.7 | 9.7 |
| Non Current Assets | 2406.8 | 8896.1 | 5721.6 | 4913.4 | 4464 | -9.1 | 16.7 |
| Total Assets | 4905.3 | 11398.3 | 8256.4 | 8389.7 | 6976.6 | -16.8 | 9.2 |
| FY21 | FY22 | FY23 | FY24 | FY25 | YOY % FY25 | CAGR % FY25 | |
|---|---|---|---|---|---|---|---|
| Cash Flow From Operating Activities | -179.4 | -2589.4 | -744.2 | -61.1 | -223.5 | 265.8 | 5.6 |
| Cash Flow From Investing Activities | -954.1 | -5789.2 | -72.3 | -1261 | 775 | -161.5 | NAN |
| Cash Flow From Financing Activities | 1118.8 | 8305.4 | 853.5 | 1456.8 | -759.9 | -152.2 | NAN |
| Free Cash Flow | -184.3 | 2446.3 | -839.3 | -133.5 | -304.2 | 127.9 | 13.3 |
| FY20 | FY21 | FY22 | FY23 | FY24 | FY25 | YOY % FY25 | CAGR % FY25 | |
|---|---|---|---|---|---|---|---|---|
| ROE(%) | -136.2 | -17.9 | -56.9 | -213.9 | -97.9 | -48.1 | -50.9 | -18.8 |
| ROCE(%) | -156.8 | -15.9 | -23.9 | -65.4 | -23.6 | -15.9 | -32.6 | -36.7 |
| ROA(%) | -58.6 | -13.1 | -35 | -63.1 | -30.2 | -22.5 | -25.5 | -17.4 |
| Current Ratios(x) | 4.3 | 15.6 | 0.7 | 1.1 | 1 | 1.4 | 40 | -20.1 |
| Type | Period / Date | Document |
|---|---|---|
| Annual Report | 2024-03 | |
| Annual Report | 2023-03 | |
| Annual Report | 2022-03 | |
| Annual Report | 2020-03 |
| Type | Period / Date | Document |
|---|
| Type | Period / Date | Document |
|---|
| Type | Period / Date | Document |
|---|---|---|
| Research Report | 2026-06 | |
| Research Report | 2026-03 |
Digital Healthcare Industry
India’s healthcare system faces challenges of accessibility, affordability, and quality, particularly for underserved populations. At the same time, the growing prevalence of chronic illnesses such as diabetes, cardiovascular diseases, and respiratory disorders is increasing the need for continuous patient monitoring and remote healthcare services. Set against this backdrop is the growth story of India’s digital healthcare infrastructure.
Supported by government initiatives like the Ayushman Bharat Digital Mission and increased investments in technology-enabled healthcare solutions, the country’s digital health market was valued at approximately USD 17.81 billion in 2025 and is expected to grow to USD 106.97 billion by 2033, a CAGR of 25.12% from FY25 to FY33. Rising smartphone adoption, widespread internet access, and a digitally savvy young population are further accelerating the adoption of digital health services across the country.
India's largest digital healthcare platform, API Holdings traces its roots to 2012, evolving from a last-mile pharmacy delivery experiment (Dialhealth) into a vertically integrated B2B distribution network (Ascent) and consumer super app (PharmEasy) over the following decade. In 2020, all group entities were consolidated under API Holdings, followed by a rapid acquisition spree in 2021 - Medlife, Thyrocare, Aknamed, and Marg ERP - that extended the group's reach across every node of the healthcare value chain: consumers, diagnostics, hospital supply, and pharmacy software.
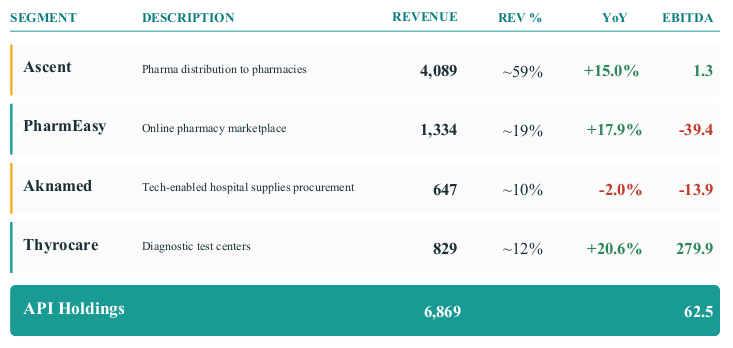
Business Segments (FY26, in crores)
Leadership:
Shareholding Pattern:
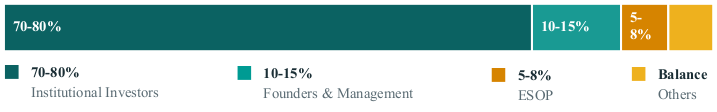
The exact cap table of API Holdings is not fully public.
FY26:
Revenue: 6869 Cr
EBITDA: 62.5 Cr (turned EBITDA positive in Q2’26)
WC days 40 from 53 in FY25
Key Metrics:
Complete financial data for FY26 is not available as of the date of writing this report.
Cash Flow Analysis:
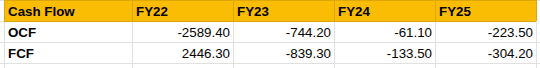
Operating Cash Flow: The FY22-24 story is the strongest argument in favour of API Holdings’ turnaround thesis. OCF improved from -₹2,589 Cr in FY22 to just -₹61 Cr in FY24, a 97.6% reduction in cash burn in two years. The improvement was driven by sharp cost rationalisation and Thyrocare's profitable operations, which contributed to positive cash flows that partially offset e-pharmacy losses. FY25 saw a minor setback, but the underlying trajectory remains intact.
Free Cash Flow: The positive figure in FY22 is due to inflow of funds. Following that, FCF has shown a positive trend with a moderate setback in FY25, in line with the operating cash flows’ trend.
Key Ratios:
A. Debt-Equity Ratio
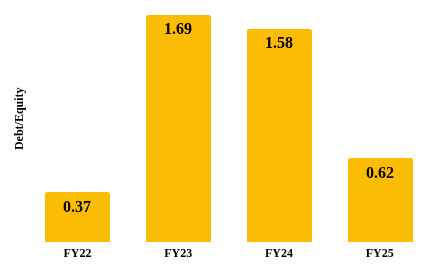
Debt-equity was low in FY22 because the company had just raised ~ $350 Mn in fresh capital and debt from Goldman Sachs had not been drawn in full. The effect was visible in subsequent years - FY23 and FY24 - where the ratio rose sharply due to decrease in equity (as a result of massive losses) and increase in total borrowings. The ratio dropped again in FY25, reflecting two things - the rights issue that brought in fresh equity and repayment of debt.
B. ROA and ROE
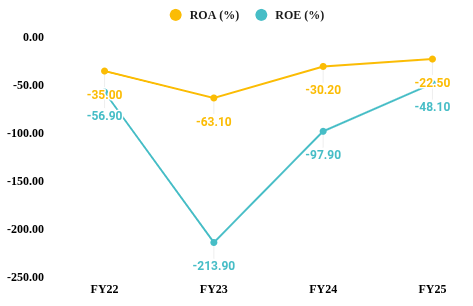
Both ROE and ROA have shown a positive trend though the values are negative considering that the company was still loss making in FY25.
ROA: The FY23 trough is due to increase in asset base as a result of the company’s acquisitions (Thyrocare, Aknamed, Medlife), while losses continue to compound. Goodwill impairments gradually reduced the asset base in FY24 and FY25 and losses narrowed which resulted in an improved ROA.
ROE: The FY23 figure is a mathematical artifact - cumulative losses reduced shareholder’s equity close to 0, so a net loss produced an extreme ROE of -213.9. The improvement in the following years reflects equity being partially restored via a rights issue.
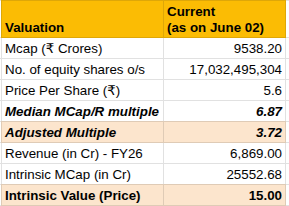
Valuation Methodology:
We employ a Market Cap/Revenue-based valuation, using median market capitalization-to-revenue multiple of listed competitors to calculate intrinsic market value of API Holdings.
This method was employed because the company has reported a net loss, making Price-to-Earnings inapplicable; and the company has not reported enough data to use Enterprise Value multiples.
The median MCap/R multiple of 6.87 was adjusted to consider three factors - illiquidity due to unlisted status, negative earnings, and holding company structure.
Analysis:
The implied intrinsic value of ₹15 per share represents a 2.67x multiple to the current unlisted market price of ₹5.60, suggesting the stock is significantly undervalued relative to peers. However, ₹15 is a forward-looking figure and not the current value. It is anchored to FY26 provisional revenue which is unaudited. If revenue is restated downward or profitability milestones slip beyond FY27, the multiple itself would compress further.
Strategic Insight:
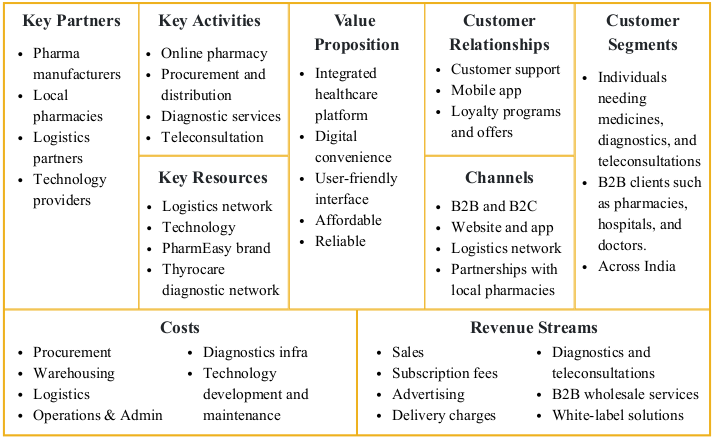
API Holdings' competitive advantage comes from owning multiple layers of the healthcare value chain:
B2C Healthcare - PharmEasy (medicine delivery, diagnostics, consultations).
B2B Pharma Distribution - Ascent and Retailio connecting manufacturers, distributors, and pharmacies.
Diagnostics - Thyrocare.
Hospital Procurement - Aknamed.
Healthcare Software - Docon and related technology solutions.
This integrated model allows API Holdings to capture value across healthcare consumption, diagnostics, distribution, and hospital procurement rather than relying solely on online pharmacy margins. Recent management commentary also indicates a stronger focus on profitability, debt reduction, and IPO readiness.
SWOT Analysis:
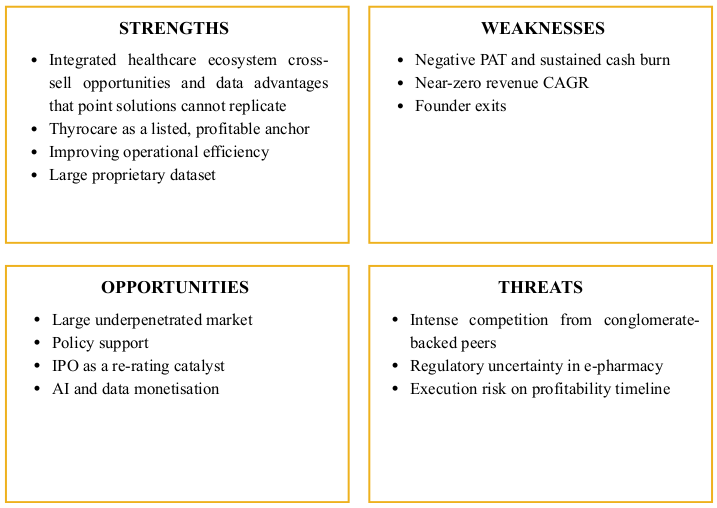
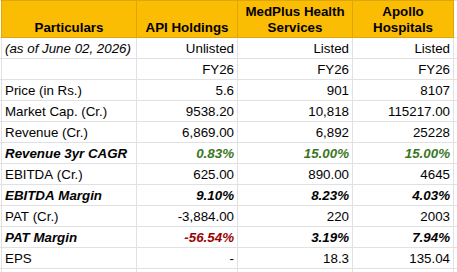
Note: PBT has been shown as PAT for API Holdings, as the company is not profitable, there is no tax.
Note: Complete financial data is not available for comparison
Analysis:
The company enjoys the highest EBITDA margin among its peers, driven by aggressive cost rationalisation and Thyrocare's high-margin diagnostics business. But this high margin is offset by negligible revenue growth and negative earnings.
API Holdings is a turnaround story in progress. EBITDA turned positive in FY26, OCF improved nearly 98% from its FY22 trough, and the balance sheet has been partially deleveraged; yet PAT remains deeply negative, revenue growth has stalled at 0.83% CAGR against an industry expanding at 13–15%, and all four co-founders have exited. At ₹5.60 per share, our risk-adjusted valuation of ₹15 implies 168% upside, anchored by Thyrocare's listed asset value and improving operating metrics.
The investment case rests entirely on whether the company can convert its 9.1% EBITDA margin into positive PAT by FY27 while simultaneously reaccelerating revenue growth toward the 13–15% industry CAGR. If it does both, the current unlisted price of ₹5.60 looks deeply undervalued. If either slips, the discount is justified.
Yes trading in unlisted shares is undoubtedly legal in India. The trading takes place in the over-the-counter market through various platforms like Sharescart.com.
No, SEBI does not regulate the unlisted share market but certain rules and regulations of SEBI are applicable in the unlisted market space as well, such as, the DP charges for each transaction, stamp duty, lock-in period and more.
You will get the best price for API Holdings Ltd - Pharmeasy and a hassle-free buying experience only on Sharescart.com platform.
API Holdings Ltd - Pharmeasy's unlisted shares can be easily purchased at Sharescart.com by following a few easy steps. Given below are the steps involved in the buying of these shares:
Step 1 - Confirm the number of shares you want to buy/sell of at the trading price.
Step 2 - Submit necessary documents like the Client Master Report (CMR) or additional documents (PAN, canceled cheque) if using a secondary bank account.
Step 3 - Transfer the trade amount to the account details shared by Sharescart.com.
Step 4 - Shares of will reflect in your Demat account within 24 hours after full payment (subject to holidays).
API Holdings Ltd - Pharmeasy's unlisted shares can be easily sold at Sharescart.com by following a few easy steps. Given below are the steps involved in the of selling of these shares:
Step 1- Confirmation on the number of shares you want to sell of API Holdings Ltd - Pharmeasy and at what price you want to sell.
Step 2- At Sharescart, we will find a suitable buyer for you according to your requirements and if you accept the trade we will move on to the transfer and the payment aspect of the trade.
Step 3- The Sharescart representative will provide you with the Demat account details to transfer your API Holdings Ltd - Pharmeasy shares. They will also notify you about the additional details required from your end before the transfer of shares such as client master copy, delivery instruction slip, and more.
Step 4- Once the transfer is complete, the payment would be credited to your bank account within 24 hours, depending on the holidays.
Over the years, the minimum ticket size for investment has dropped as more and more people have started investing in the Unlisted market. Currently, the minimum ticket size for API Holdings Ltd - Pharmeasy is between 25,000 to 31,000.
Brokers or dealers provide you with a trading facility means you can buy and sell shares with your broker but when you buy shares the Depository holds your shares. There are mainly two depositories NSDL and CDSL.
If you want to check your shares in NSDL and CDSL you need to download the application (NSDL Speede App or CDSL myeasi).
The taxation on the API Holdings Ltd - Pharmeasy shares may vary depending on 2 Factors:
Short-term capital
Unlisted shares - In unlisted shares, the taxation of short-term capital gain i.e. less than 24 months is taxable according to the investor's income tax slab.
Listed Shares - In listed shares, the taxation for short-term capital gains i.e. less than 12 months is at 20% without indexation benefits.
Long-term capital
Unlisted shares - The taxation for long-term capital gain i.e. more than 24 months is taxable at 12.5% without indexation benefits.
Listed Shares - The taxation for long-term capital gains i.e. more than 12 months is at 12.5% after an exemption of 1.25 lakh.
According to the current rule issued by SEBI last year in August 2021, the lock-in period is brought down from 1 year to 6 months. This was done to entice more investors to invest their money in pre-IPO companies and startups. The lock-in period of API Holdings Ltd - Pharmeasy varies depending on which type of investor you are:
You can check daily share prices of companies on our website or register with us using your phone number where you will get daily whatsapp updates on company news and other essential informations.

Buy or sell shares with confidence, backed by our research and expert guidance.

Manam Chocolate has raised $9 million (~₹77 crore) in a funding round led by Omnivore, with participation from the Turne...
Smartphone maker Lava is targeting a 10% share of India's sub-₹30,000 smartphone market by 2030, backed by strong g...
Capital Small Finance Bank has announced a final dividend of ₹5 per share (50% on face value of ₹10) for FY26, with Ju...

Quick commerce startup BazaarNow has raised ₹72 crore in a funding round led by Peak XV Partners, with participation fro...

Infosys-backed precision oncology startup 4baseCare has raised ₹128 crore, including a ₹38 crore top-up round led by I...

NCDEX is set to restart pepper futures trading after more than a decade, having secured regulatory approval and resolved e...
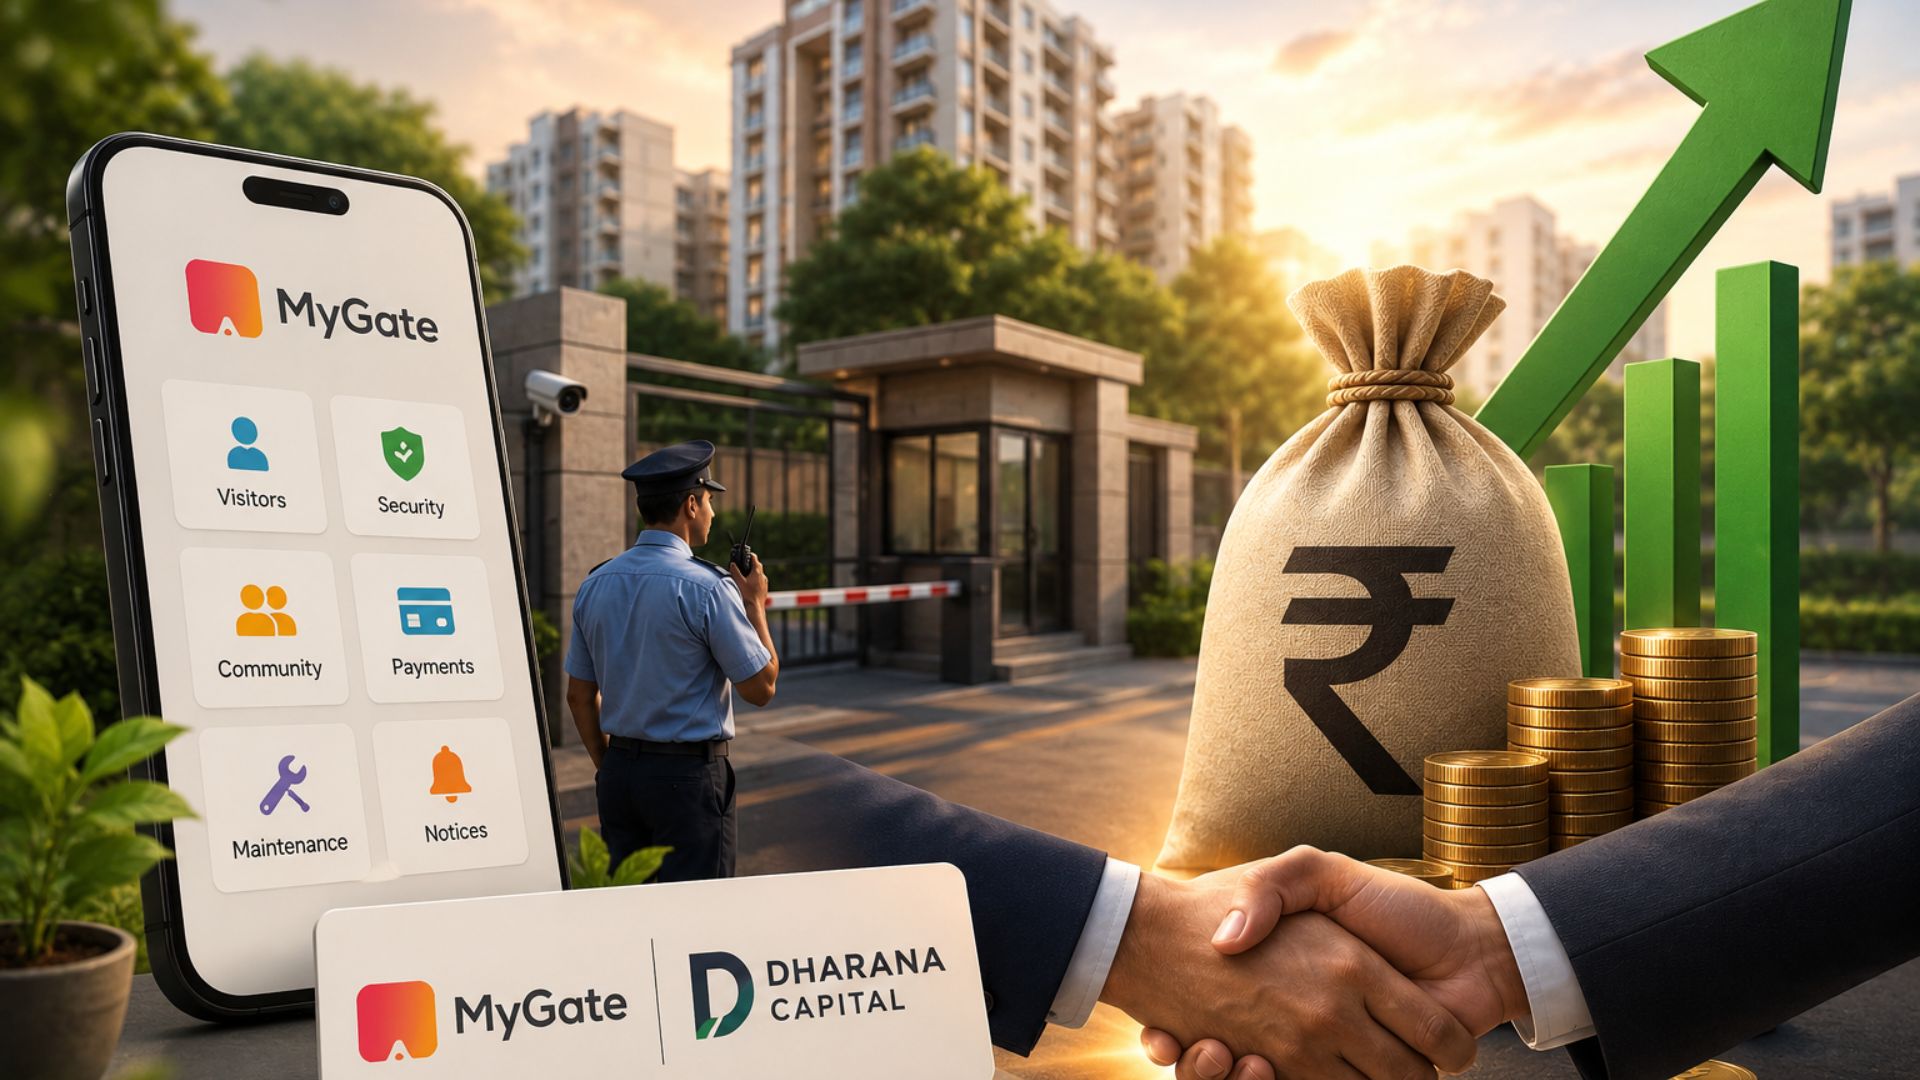
MyGate, the residential community management platform, has raised ₹225 crore from Dharana Capital.
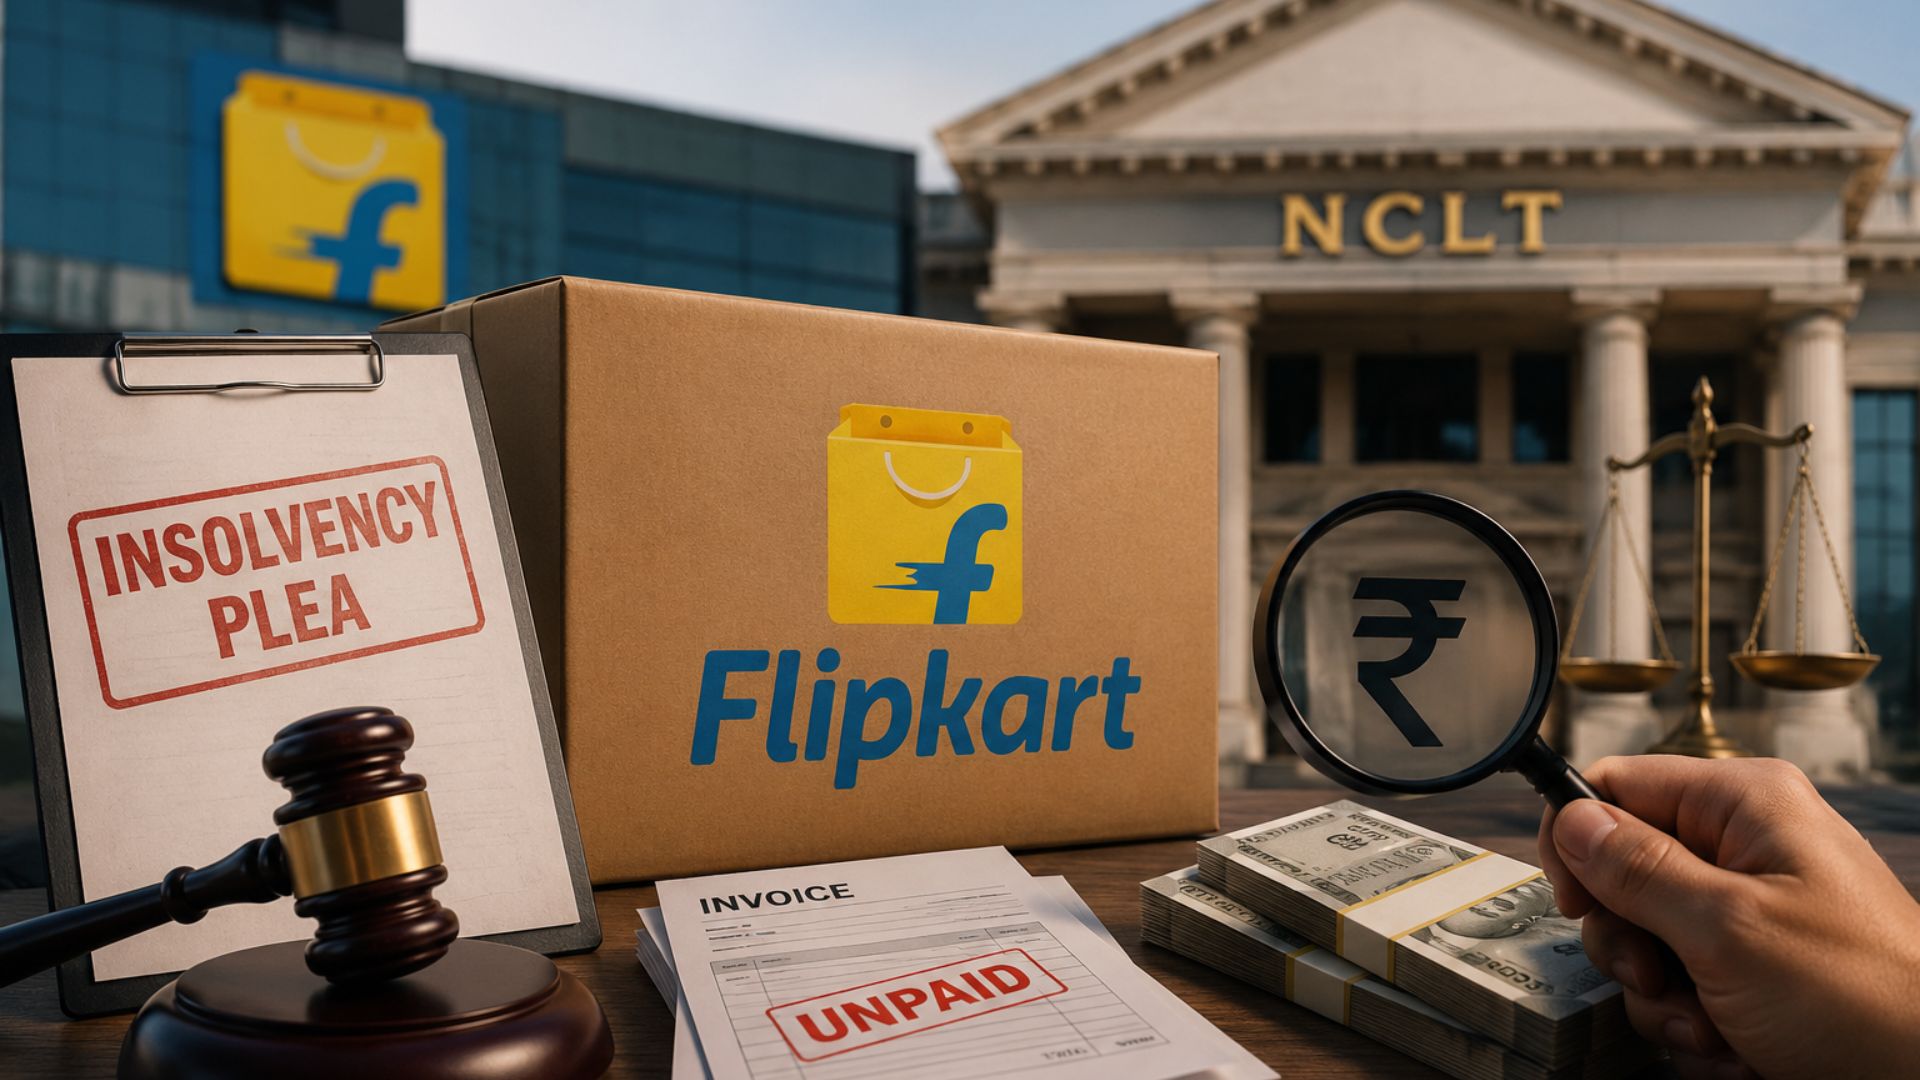
Flipkart has received an NCLT notice after Applabs Media filed an insolvency petition alleging unpaid dues of ₹1.69 cror...

The Competition Commission of India (CCI) has approved Sanlam Emerging Markets' acquisition of an additional 2.8%...

SBI General Insurance may be the next SBI subsidiary headed for the stock market.